
If you’ve been around the web long enough, chances are high you’ve come across some pretty stunning visualizations all over the web.
A lot of these are built using D3.js, a Javascript library that “brings data to life” using open web standards – HTML, CSS, and SVG. It allows you to bind any kind of data to the DOM and apply different kinds of transformations on them. A simple example would be using D3 to create a HTML table from an array of JSON objects. “Well”, you might be thinking, “that’s not so great. That can be done using plain Javascript.”
Another great benefit D3 brings to the table is its extensibility, with over a dozen different
plugins to help you create everything from Euler diagrams to 3D visualizations. The same data can be simply used to make the charts interactive and even add on some smooth transitions when the data changes, for instance. Essentially, D3 provides an invaluable tool for data visualization without the need for jumping through a thousand different hoops.
Of course, D3 is more than just a data visualization tool. One of the most compelling use-cases is making beautiful maps.
A Gentle Introduction to D3.js
A lot of developers are afraid of libraries like D3 because some forms of data visualization require you to understand some pretty complicated mathematics. However, it’s a lot less intimidating once you start. By the time you have to deal with complex graphs, you should already have mastered the basics. As long as you understand web concepts like SVG, HTML, and CSS, the concepts should come pretty naturally.
D3 is the shorthand for Data-Driven Documents, it’s a Javascript library that binds any arbitrary data onto the DOM. These can then be manipulated to produce any kind of visualization you need for your project.
One major advantage D3 has as compared to using plain Javascript is that it is highly functional. This helps to make your code easy to reuse since it relies on method chaining to a great degree. This extensibility means dozens of plugins and components can be used together with d3. These can be incredibly useful if you’re in a hurry or understand the underlying concepts and don’t want to reinvent the wheel.
As outlined by the site’s homepage, the library can be used for everything from simplifying your code from verbose and not-easily-readable
var paragraphs = document.getElementsByTagName("p");
for (var i = 0; i < paragraphs.length; i++) {
     var paragraph = paragraphs.item(i);
     paragraph.style.setProperty("color", "blue", null);
}
To simple and declarative:
d3.selectAll("p").style("color", "blue");
But that’s jQuery’s area to shine. D3 is loved for its ability to turn data:
const ratData = [400, 900, 300, 600];
into HTML elements
<svg width="100" height="150"> <rect x="0" width="15" fill="#d1c9b8"></rect> <rect x="25" width="15" fill="#d1c9b8"></rect> <rect x="50" width="15" fill="#d1c9b8"></rect> <rect x="75" width="15" fill="#d1c9b8"></rect>< </svg>
What does all this have to do with maps?
Well, one of the most compelling reasons to use D3 comes in the form of cartography. Again, as the site itself outlines, functions like d3.geoPath have made it a simple and reliable tool for projecting geographic data into SVG path data. This is with the help of another web standard called TopoJSON.
TopoJSON is an extension of GeoJson that comes with a trove of additional features, the most important of which is perhaps the reduced file size.
For instance, if we wanted to create a simple map of the United States, all we have to do is import the TopoJSON and use D3 to render their coordinates on an SVG.
If it looks intimidating, let’s break it all down:
const width = 900;
const height = 600;
const svg = d3.select("body").append("svg")
   .attr("width", width)
   .attr("height", height);
First, we create a container where the elements we want to draw will go. If you’ve used jQuery in the past, the syntax should look familiar. However, there are two key differences to be aware of:
- d3.append method only takes the name of the element, not actual markup
ie. d3.select(‘body’).append(‘svg’)and not$(‘body’).append(‘<svg/>’) d3.appendreturns the appended element, not the parent. Therefore, any attributes added afterward will be appended to the svg, not the body like in jQuery.
const projection = d3.geoAlbersUsa()
   .translate([width / 2, height / 2]) // translate to center of screen
   .scale([1000]); //shrink it down so all states are visible
The geoAlbersUsa projection is used to provide an Albers Projection of the United States.
const path = d3.geoPath().projection(projection);
<!DOCTYPE html>
<html lang="en">
<head>
    <meta charset="utf-8">
    <title>D3 World Map</title>
    <style>
    path {
        stroke: white;
        stroke-width: 0.5px;
        fill: black;
    }
    </style>
    <script src="https://d3js.org/d3.v4.min.js"></script>
    <script src="https://d3js.org/topojson.v2.min.js"></script>
</head>
<body>
<script type="text/javascript">
const width = 900;
const height = 600;
const svg = d3.select("body").append("svg")
    .attr("width", width)
    .attr("height", height);

const projection = d3.geoAlbersUsa()
    .translate([width / 2, height / 2]) // translate to center of screen
    .scale([1000]); // scale things down so see entire US

const path = d3.geoPath().projection(projection);

d3.json("https://gist.githubusercontent.com/Bradleykingz/3aa5206b6819a3c38b5d73cb814ed470/raw/a476b9098ba0244718b496697c5b350460d32f99/us-states.json", function(error, uState) {
if (error) throw error;
    svg.selectAll('path')
        .data(uState.features)
        .enter()
        .append('path')
        .attr("d", path)
});

</script>
</body>
</html>
This creates a new geographic path generator for us. A path generator is simply a function that takes a GeoJSON feature and prints out SVG path data. If a projection is specified, it’s used in rendering the SVG.
d3.json("https://gist.githubusercontent.com/Bradleykingz/3aa5206b6819a3c38b5d73cb814ed470/raw/a476b9098ba0244718b496697c5b350460d32f99/us-states.json", function(error, uState) {
   if (error) throw error;
   svg.selectAll('path')
     .data(uState.features)
     .enter()
     .append('path')
     .attr("d", path)
});
The d3.json() method sends a HTTP request to the specified path and retrieves JSON objects, and we listen for a response in the callback. For this project, I load a modified TopoJSON originally from leaflet.js.Have you noticed something? The ‘selectAll()’ method is supposed to select all elements of a particular type, but as of yet, no ‘path’ elements exist. So, what is it selecting?
This method works such that if it doesn’t find the element it’s looking for, we get an empty selection. Think of this as preparing the SVG with placeholders for data that’s going to be inserted later. And in the next, line, that’s exactly what we do.
The data method is the life and blood of D3. Its core function is to bind data to page elements. It works together with the enter function to refer to incoming data that is not yet represented on the page.
Here is a section of the TopoJSON we are working with. The most important part of this file is under the ‘features’ key.
{
  "type": "FeatureCollection",
  "features": [
   {
    "type": "Feature",
    "id": "01",
    "properties": {
     "name": "Alabama"
    },
    "geometry": {
     "type": "Polygon",
     "coordinates": [
      [
       //...
      ]
     ]
    }
   }
  ]
}
For every feature fed to the data function, we will append a ‘path’ and that path will have an attribute, ‘d’ with the value passed from the geoPath we had created earlier.
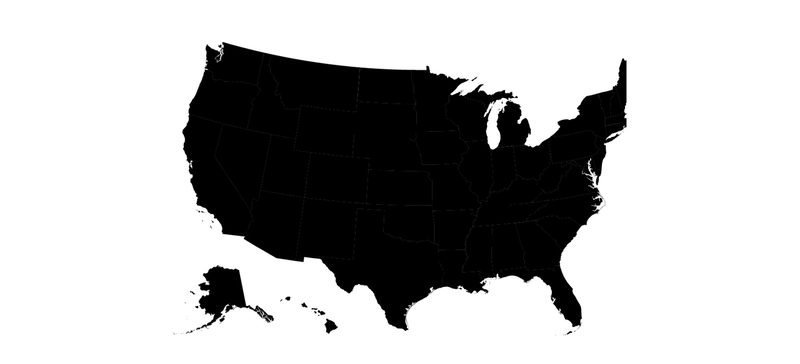
So far, we haven’t done very much. All that work produces the following (rather dull) map:
We could make this a little more exciting by adding some CSS styling:
//…
.state {
  stroke-width: 1;
  stroke: #ffffff;
}
//...
And adding one line line to our Javascript code:
//...
svg.selectAll('path')
   .data(uState.features)
   .enter()
   .append('path')
   .attr("d", path)
   .attr('class', 'state')
//...
That makes the state borders better visible, but even then it still produces the following (still kind of boring) map:
So we’ll add a bit more interactivity, some more CSS:
//…
.state:hover {
  fill: red;
  cursor: pointer;
}
//…
Which produces:
gif of boring d3 map – adding interactivityGreat. When we hover any state, its color changes to red. It’s not perfect, but better. Things are starting to come together. But let’s step things up a little bit more. For instance, we could plot real data to these states.
Say we wanted to plot data like unemployment rates in the US state by state in 2020. First we’ll need to make sure the data is easy to access. I used a JSON store online to make it easily-accessible, so we’re past the first step.
Let’s get crackin’.
Plotting data to a map with D3
The most basic elements every map should have are a title, a scale, and a legend. D3 comes with methods that can help us take care of the latter two features – all the first takes is some simple HTML.
To produce a scale, we need a few crucial details from the data we are going to plot: the domain and range. The ‘domain’ is the set of all possible input values while ‘range’ is the set of all possible output values.
These are both fairly easy to find with D3.
const colorScale = d3.scaleLinear()
    .domain([min, max])
     //I goofed, so this has to be in reverse order
    .range(["#00806D", "#00BC4C", "#00F200", "#85FB44"].reverse());
We create a linear scale and assign it a domain and range. Again, the domain is simply the set of all numbers accepted by a function. That is – all the numbers you want to represent on the map. For most applications, all you have to do is supply the function with the lowest and highest numbers in our set, which the range function accepts as range([min, max]). (That’s not always the case, however, as we’ll see later on)
Another area where D3 comes in strongly is with regards to the dozens of small helpers that it makes available. In this case, we rely on the min and max functions. They are pretty intuitive to use:
let numbers= [2,3,9,12,20,15,25,4,31,6,7,12,18]
console.log(d3.min(numbers));
//2
console.log(d3.max(numbers))
//31
But here is what the ‘data’ portion of the dataset we’re working with looks like:
//..
{
"State": "Vermont",
"unemploymentRateRank": 1,
"unemploymentRate": "0.0210",
"Pop": 628061
},
//..
To deal with such problems, aside from the simple functions provided by d3 such as `min` and `max`, more complex objects can be accessed using a function. If you’re familiar with higher-order Javascript functions like `filter` and `find` the syntax should look familiar.
let max = d3.max(response.data, function (d, i) {
    return d.unemploymentRate;
});
let min = d3.min(response.data, function (d, i) {
    return d.unemploymentRate;
});
Functions like attr, max, and min accept two arguments – the data and a callback function that tells the parent function which data to access. The first parameter in the callback is usually the current data while the second is the index of the data.
Finally, we give our scale function a range of data within which it can work. In this case, the ‘range’ is the colors that will be used to represent the ‘intensity’ of a particular metric that we pass. The spectrum I used was helpfully generated by this tool.
Now, what needs to happen is merging these two datasets in one file that can be referenced by D3. For this, we used lodash and a helpful function from Stackoverflow.
_(uState.features)
    .keyBy('properties.name')
    .merge(_.keyBy(response.data, 'State'))
    .values()
    .value();
We merge ‘uState.features’ into ‘response.data’ using the ‘properties.name’ and ‘State’ keys respectively. You could do the same using two for loops if you’d rather not add another library to your project.
Here is what our merged object will look like:
Ideally, all extra properties should be within the ‘properties’ key, but this works well enough for demonstration purposes. And finally, we use the scale to return suitable colors for our map:
svg.selectAll('path')
    .data(uState.features)
    .enter()
    .append('path')
    .attr("d", path)
    .attr('class', 'state')
    .style('fill', function (d, i) {
        let uRate = d.unemploymentRate;
        return uRate ? colorScale(uRate) : "#ccc";
    })
And voila!
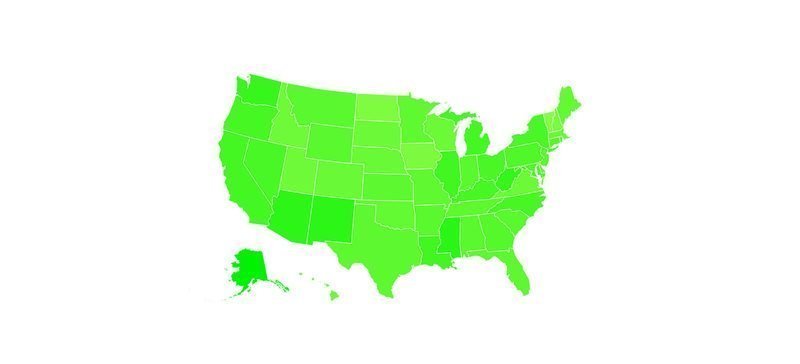
It’s quite a… striking map, but hopefully, you’re better at picking colors than me. All that color imbalance is because we have a rather small domain, especially given how small the differences between data values are.
Creating a more suitable d3 scale
Alaska has the highest unemployment rate – 0.064 while Alabama has the lowest – 0.035, giving us a [0.035, 0.064] domain to work with. Since this function doesn’t know anything else about our data, the linear function used within can’t provide a whole lot of color variation (linear functions preserve proportional differences between pieces of data). We have to expand the domain somehow – but providing all the data would just slow down our site, especially when dealing with large amounts of data.
Instead, let’s try and fairly represent the data with the following function:
function selectDivisionNumber(array) {
    let arraySize = array.length,
        halfArray = Math.round(arraySize / 2);
    let newArr = [];
    //Take first and last item and push them to the array
    newArr.push(array[0])
    newArr.push(array[arraySize - 1]);
    //Don't mind the order, they will be sorted later.
    //Divide the array in two
    let firstHalf = array.slice(0, halfArray);
    let firstHalfSelection = firstHalf[Math.round(firstHalf.length / 2)];
    newArr.push(firstHalfSelection);

    let secondHalf = array.slice(halfArray, arraySize);
    let secondHalfSelection = secondHalf[Math.round(secondHalf.length / 2)];
    newArr.push(secondHalfSelection);
    return newArr;
}
So that our new domain becomes:
let sampleMap = response.data.map(item => {
    return Number(item.unemploymentRate);
});
let domain = selectDivisionNumber(sampleMap).sort();
Note: Notice how we avoided using `parseInt` to convert our strings to numbers Using `parseInt` and `map` together can often be disastrous.
colors don’t change on d3 map – hovering over statesAnyway, once that’s done, we can go back to our map, and, you might notice something strange:
Hovering over the states doesn’t change the colors any longer. That’s because the `style` function sets inline styles and those take precedence over external styles or styles defined in the `head`. We need a better solution.
Changing colors on hover with d3’s `on` method
The saving function comes in the form of d3’s `on` method, which allows us to listen to methods like ‘mouseover, like so:
//...
.on("mouseover", function (d) {

})
//..
When we hover over a state, I want to change its color so that it’s just slightly darker. For this, I use a utility library – tinyColor.
.on("mouseover", function (d) {
    d3.select(this)
        .style("fill", tinycolor(colorScale(d.unemploymentRate)).darken(15).toString())
        .style("cursor", "pointer");
})
//remove styling when the mouse leaves.
.on("mouseout", function (d, i) {
    //set this color to its default
    d3.select(this).style("fill", function () {
        let uRate = d.unemploymentRate;
        return uRate ? colorScale(uRate) : "#ccc";
    });
//make the tooltip transparent
    tooltip.transition()
        .duration(500)
        .style("opacity", 0);
})
The complete function will look like this:
svg.selectAll('path')
    .data(uState.features)
    .enter()
    .append('path')
    .attr("d", path)
 //add CSS transition styling
    .style('transition', "all 0.2s ease-in-out")
    .attr('class', 'state')
    .style('fill', function (d, i) {
        let uRate = d.unemploymentRate;
        return uRate ? colorScale(uRate) : "#ccc";
    })
    .on("mouseover", function (d) {
        d3.select(this)
            .style("fill", tinycolor(colorScale(d.unemploymentRate)).darken(15).toString())
            .style("cursor", "pointer");
    })
    .on("mouseout", function (d, i) {
        d3.select(this).style("fill", function () {
            let uRate = d.unemploymentRate;
            return uRate ? colorScale(uRate) : "#ccc";
        });
        tooltip.transition()
            .duration(500)
            .style("opacity", 0);
    });
pretty d3 map – further work on the mapAnd that’s great! We’re down to an even prettier version of our original map:
But we’re still not yet done. The map looks great but it’s impossible to read any kind of data from it so far. If we want to tell a potential visitor what the colors indicate, we are going to need a legend.
Adding a legend
D3 doesn’t have a specific module for creating legends, it’s fairly simple to create one with the available APIs.
//create a new SVG in the body
const legend = d3.select("body").append('svg')
//add it with the '.legend' class
    .attr('class', 'legend')
    //it should be 14px wide
    .attr('width', 148)
    //and 148px high
    .attr('height', 148)
    //then either select all the 'g's inside the svg
    //or create placeholders
    .selectAll('g')
    //Fill the data into our placeholders in reverse order
    //This arranges our legend in descending order.
    //The 'data' here is the items we entered in the 'domain',
    //in this case [min, max]
    //We use 'slice()' to create a shallow copy of the array
    //Since we don't want to modify the original one
    .data(colorScale.domain().slice().reverse())
    //Every node in teh data should have a 'g' appended
    .enter().append('g')
    //the 'g' should have this attribute
    .attr("transform", function(d, i) { return "translate(0," + i * 20 + ")"; });
//Inside every 'legend', insert a rect
legend.append("rect")
    //that's 18px wide
    .attr("width", 18)
    //and 18px high
    .attr("height", 18)
    //then fill it will the color assigned by the scale
    .style("fill", colorScale);
legend.append("text")
    .attr("x", 24)
    .attr("y", 9)
    .attr("dy", ".35em")
    .text(function(d) { return `${(d*100).round(2).toFixed(1)}%`});
round is a utility function that can be used to round off numbers. It’s defined as
Number.prototype.round = function (decimals) {
    return Number((Math.round(this + "e" + decimals) + "e-" + decimals));
};
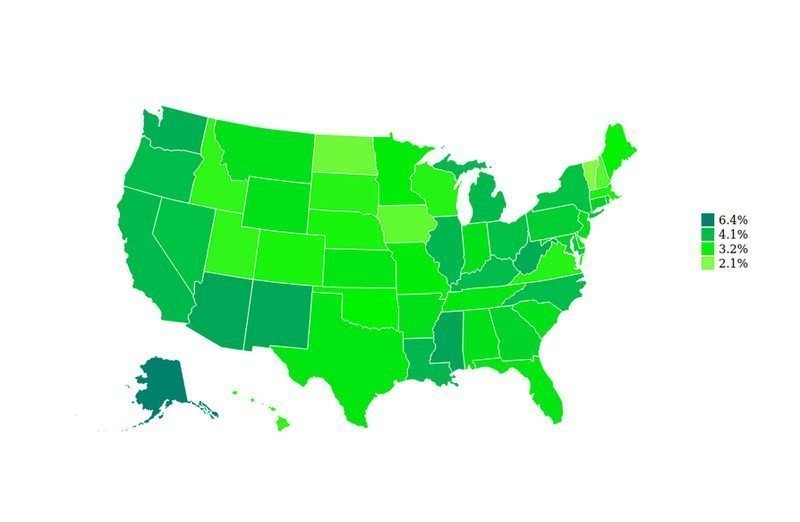
That brings us down to:
Adding a tooltip
Now we have almost everything we need. All that’s left is to add a tooltip so that whenever someone hovers over a state, we can read the information we want faster:
First, we add the styling
div.tooltip {
  position: absolute;
  text-align: center;
  width: 60px;
  min-height: 28px;
  padding: 8px 12px;
  font: 12px sans-serif;
  background: lightgray;
  border: 0px;
  border-radius: 8px;
  pointer-events: none;
}
Then add a listener for whenever the mouse moves:
.on('mousemove', function (d) {
    tooltip.transition()
        .duration(200)
        .style("opacity", .9);
//Any time the mouse moves, the tooltip should be at the same position
    tooltip.style("left", (d3.event.pageX) + "px")
        .style("top", (d3.event.pageY) + "px")
//The text inside should be State: rate%
        .text(()=> `${d.State}: ${(d.unemploymentRate*100).round(2).toFixed(1)}%`)
})
Now, all that’s left is to add a title and we’ll be done.
Notes:
- While this graph is great, one improvement it could use is the labeling of the legend.
- The tooltip pointer could use a little CSS styling to add an arrow
- A small delay could be added to the movement of the tooltip to make its movements feel more natural
- To access the full code, check out this gist.
- Some colors may be lost due to image compression.
Is that all?
As it turns out, D3 is a really large and complex library capable of a lot more than just data visualization. For one, it’s a really good choice for placing additional data at latitudes and longitudes on rendered maps. It’s also great for some complicated maps, once you’ve gotten the hang of it.
In addition to which, it’s a great solution for creating slippy maps – that is, maps that can be panned and zoomed. This is usually done in combination with libraries like Google Maps or Leaflet.js.
We are going to cover the implementation of the latter of these in the coming days, so keep an eye out!
Summary
D3 is a solid data visualization library. However, its uses go far beyond simple charts. It can also be used to overlay data over maps and even to draw maps themselves. The possibilities are endless.
Code: https://gist.github.com/Bradleykingz/659792d186326da8b2684a425871a8e0
Git repo: https://github.com/Bradleykingz/working-with-d3
jsFiddle: https://jsfiddle.net/uaz8gpeo/