


In the last article, we went over how to use D3.js to draw maps and populate them with data. All you need to achieve this is a solid knowledge of web fundamentals such as SVG and Javascript. It should serve as a great introduction to applying d3 in modern map-making concepts.
Unfortunately, there are quite a number of topics not suitable for introduction in a beginner’s context. The good news is, once you’ve gone over that guide and understood the basics, you’re ready to take the next step, and we’re here to help you with that. However, this article also briefly goes over basic concepts like GeoJSON, but goes into finer detail on topics we’d simply skimmed over before, such as path generators. It also introduces new concepts like how to pan and zoom using d3-zoom, and even better, how to work with colors!
Finally, we will also visit how to work with how to change data sets in d3, where to source data and how to create a good scale. Above is a preview of the map we are going to make.
Let’s get started.
A primer: D3 and Geographic Data
There are three core concepts you will need to be really familiar with if you’re going to be using D3 in conjunction with geolocation data. These are geojson, projections and path generators.
GeoJSON
GIS (Geographic Information System) refers to a framework designed to capture, store, manipulate and enable the presentation of different kinds of geographic data. This is important because it introduces the concept of ‘spatial’ data. These are data that can be mapped and referenced to locations on the earth’s surface.
GeoJSON is a GIS standard that differs from most others in that it’s open source and community-maintained. It’s a modern, human-readable GIS standard for representing geographic features in JSON format.
A typical GeoJSON file looks like this:
{
 "type": "FeatureCollection",
 "features": [
   {
     "type": "Feature",
     "id": "01",
     "properties": {
       "name": "Alabama"
     },
     "geometry": {
       "type": "Polygon",
       "coordinates": [
         [
           //...
         ]
       ]
     }
   }
 ]
}
}
The most important part of a GeoJSON file is the ‘features’ array. It contains objects that represent different features that can be plotted onto a map. Each feature, in turn, is a JSON object that contains a string representing its borders and metadata. The latter is usually contained under the ‘properties’ object.
In this case, we only have one feature and the only metadata it contains is the name of the state – Alabama.
Every GeoJSON object also includes a ‘geometry’ object that has the coordinates of the feature’s border. These coordinates are taken in by path generators to produce SVG shapes.
TopoJSON is an extension of the GeoJSON standard that provides smaller file sizes and is the preferred format for geospatial topology. It achieves this smaller file size by compacting and combining shared line segments rather than having unique ones for each. It also stores relational information between geographic features rather than simple spatial information alone. As a result, TopoJSON files can be up to 80% smaller than their GeoJSON counterparts.
Since D3 takes care of most of the complicated rendering details, a passing knowledge of GeoJSON is usually enough to create great maps.
Projections
A projection is a function that takes a latitude and longitude and produces x and y coordinates. It’s not too different from the concept of normal map projections, which flatten a globe’s surface into a plane when making a map. Since we’re not limited to plane 2D projection, however, there are over a dozen different projections to choose from when working with d3.
Every projection has its fair share of upsides and downsides. For instance, the Albers Projection shows an accurate area but distorts shapes. To use it together with D3:
const projection = d3.geoAlbers()
projection([-3.0026, 16.7666])
// [ 1963.7439563777957, -129.208217097422 ]
Path generators
A path generator is a function that converts a GeoJSON object into an SVG path. This is where the bulk of the work d3 does happen. It is created in conjunction with the projection we created before, like so:
const projection = d3.geoAlbers()
const generator = d3.geoPath().projection(projection);
const geoJson = {
 "type": "FeatureCollection",
 "features": [
   {
     "type": "Feature",
     "id": "01",
     "properties": {
       "name": "Alabama"
     },
     "geometry": {
       "type": "Polygon",
       "coordinates": [
         [
           //...
         ]
       ]
     }
   }
 ]
}
}
generator(geoJson);
Where to Source Data
Before making any map, you will need a fair amount of data. Unless you really want to get into it, you will almost never need to create your own GeoJSON. There are tons of sites where you can download the prepared data instead. By far the best resource for this is Natural Earth. It’s a public domain dataset that contains various raster and vector map data. Anything to do with climate change, political boundaries and anything of the like can probably be found there.
If you’d rather do the dirty work yourself, you can easily export shapefiles (which can then be converted to GeoJSON) using apps like PostGIS, QGIS and GDAL.
Another place to source data is Datahub, which also provides a search API. Different organizations, such as the World Bank and government agencies, such as the U.S. Geological Survey and the U.S. Census Bureau, provide open access to their data, too.
The data doesn’t have to be GeoJSON, either. It’s possible to have a separate GeoJSON file and merge it with a dataset you’re working with as long as they have at least one characteristic in common (like we did in the last article, for example). One of the most comprehensive sources for this kind of data is OurWorldInData. All data on the site is quite comprehensive – thoroughly researched, cited, reviewed, and completely free.
Finally, if you are simply looking for GeoJSON files of the world – whole continents or even individual countries – and are having a bit of trouble, you might find GeoJSON Maps infinitely useful.
Building a map of the world
Since we already went over a lot of the concepts needed for this article before, we’ll gloss over a lot of the code and only explain details that are not immediately clear. This guide should still be relatively easy to follow all the same.
The first thing we’re going to do is draw a map of the world. For this, we’ve leveraged the aforementioned GeoJSON maps to select every continent and import them into our application. For my part, I’ve stored them in a ‘json’ folder and exported it via Javascript like so:
const worldMap = {
"type": "FeatureCollection",
"features": [
 {...}
]
//...
}
To start us off, we’re going to need the following dependencies:
<script src="json/world.js"></script>
<script src="https://d3js.org/d3.v4.min.js"></script>
<script src="https://d3js.org/topojson.v2.min.js"></script>
And to draw the map, we’re going to use the same procedure from before:
const width = 1000;
const height = 700;

const projection = d3.geoMercator()
   .translate([width / 2, height / 1.4])    // translate to center of screen. You might have to fiddle with this
                            //depending on the size of your screen
   .scale([150]);

const path = d3.geoPath().projection(projection);

const container = d3.select(".home");
const svg = container.append("svg");

svg.attr("width", width)
   .attr("height", height)
   .append('g');

svg.selectAll('path')
   .data(worldMap.features)
   .enter()
   .append('path')
   .attr('d', path)
   .attr('class', 'country');
And after adding some styling:
body {
 display: flex;
 flex-direction: column;
 justify-content: center;
 align-items: center;
 min-height: 100vh;
 font-family: "Open Sans", sans-serif;
}
.country {
 stroke-width: 1;
 stroke: darkslategrey;
 fill: white;
 transition: all 0.25s ease-in-out;
}

.country:hover {
 cursor: pointer;
 fill: #555555;
}
We have a functional world map:
For this application, we rely on the Mercator projection.
Next up, we’ll need to load up some data. For this, I leveraged a dataset from OurWorldInData (You might notice that we are essentially recreating this particular application in our own style.)
To make things simpler to reference, I’ve uploaded them to a Github repo, where can access the CSV file using this link.
To load up the data, we rely on d3.csv. This fetches the CSV file for us and parses it into a JSON file. And speaking of fetching, this method needs a new dependency:
To load up the data, we rely on d3.csv. This fetches the CSV file for us and parses it into a JSON file. And speaking of fetching, this method needs a new dependency:
<script src="https://d3js.org/d3-fetch.v1.min.js"></script>
To fetch the data:
let lifeExpectancyCsv = 'https://raw.githubusercontent.com/Bradleykingz/working-with-d3/master/files/life-expectancy.csv';
d3.csv(lifeExpectancyCsv).then(data => {
//...
}
Entity,Code,Year,LifeExpecacy
Afghanistan,AFG,1950,27.638
Afghanistan,AFG,1951,27.878
Afghanistan,AFG,1952,28.361
//...
(Don’t mind the typo for now)
It contains a list of data from every country around the world – the name, it’s ISO 3 name and the life expectancy over the specified year. This dataset goes from as far back as 1913 (for some countries) to 2019 (for most countries).
Parsed into JSON, a single JSON object will be represented by:
{
Code: "AFG",
Entity: "Afghanistan",
LifeExpectacy: "27.638",
Year: "1950"
}
And the metadata from our GeoJSON looks like:
"properties": {
      //...
        "abbrev": "U.S.A.",
        "postal": "US",
        "formal_en": "United States of America",
        "pop_year": 0,
        "iso_a3": "USA",
      //...
},
Since both files share a common ISO 3 naming field, merging the two datasets should be fairly simple. Note that for this, we’re going to need lodash. To add it:
<script src="https://cdn.jsdelivr.net/npm/lodash@4.17.15/lodash.min.js"></script>
But the typo in the CSV file really bothers me, not to mention it elevates the possibility of running into bugs tenfold, so let’s fix it.
let newArr = _.map(data, era => ({
   entity: era['Entity'],
   lifeExpectancy: +(era['LifeExpectacy']),
   code: era['Code'],
   year: +(era['Year'])
}));
Note that we use the ‘+’ operator to convert strings to integers. This is preferable to parseInt because parseInt tends to cause problems and it’s preferable still to ‘Number()’ because it works on both floats and integers.
We’ll rely on a handy method borrowed from Stackoverflow to merge the two arrays together:
let newArr = _.map(data, era => ({
   entity: era['Entity'],
   lifeExpectancy: +(era['LifeExpectacy']),
   code: era['Code'],
   year: +(era['Year'])
}));

let mergedArray = _(newArr)
   .keyBy('code')
   .merge(_.keyBy(worldMap.features, 'properties.iso_a3'))
   .values()
   .value();
So that our new CSV data + GeoJSON looks like:
{
code: "AFG"
entity: "Afghanistan"
geometry: { ...}
lifeExpectancy: 64.833
properties: {...}
type: "Feature"
year: 2019
}
We’ll need to reflect that data onto a map, but since it’s an array of several different years, we need to filter out data we don’t need. For simplicity’s sake, we will only use data from 2000 upwards. Note, however, that since I use a filter function, past data is still as easily-accessible.
//this is a global variable
const currentYear = 2000;
let filteredArray =  _.filter(newArr, today => {
   return today['year'] === currentYear;
});
This is a pretty standard filter function. All it does is get data from a specified year and only return objects that match it. For instance, this particular function will only return objects from the year 2000.
Refactoring our code so that the SVG renders using the new object, our final code becomes:
//...
d3.csv(lifeExpectancyCsv).then(data => {

   let newArr = _.map(data, era => ({
       entity: era['Entity'],
       lifeExpectancy: +(era['LifeExpectacy']),
       code: era['Code'],
       year: +(era['Year'])
   }));

   const currentYear = 2000;

   let filteredArray =  _.filter(newArr, today => {
       return today['year'] === currentYear;
   });

   let mergedGeoJson = _(filteredArray)
       .keyBy('code')
       .merge(_.keyBy(worldMap.features, 'properties.iso_a3'))
       .values()
       .value();

   svg.selectAll('path')
       .data(mergedGeoJson)
       .enter()
       .append('path')
       .attr('d', path)
       .attr('class', 'country');

});
But that doesn’t really add anything. Let’s start messing around with some colors!
Using d3-scale and d3-scale-chromatic for color scales in D3
To map life expectancies, we first need a scale. Let’s borrow the same scale we used before:
const colorScale = d3.scaleLinear()
    .domain([min, max])
     //I goofed, so this has to be in reverse order
    .range(["#00806D", "#00BC4C", "#00F200", "#85FB44"].reverse());
And to add a bit of flair, we want the colors to change when we hover them. For this, I like to use tinyColor. A small library for doing things like darkening and lightening (which you may be familiar with if you’ve used SASS before).
To add it:
<script src="https://cdnjs.cloudflare.com/ajax/libs/tinycolor/1.4.1/tinycolor.js"></script>
And, in action:
//darken the background color on hover
.on('mouseover', function (d) {
       d3.select(this)
         .style('fill', tinycolor(colorScale(d.lifeExpectancy)).darken(10).toString());
   }).on('mouseout', function (d) {
//And reset it to normal when the mouse leaves
       d3.select(this)
         .style('fill', colorScale(d.lifeExpectancy));
});
Now, even if you’re not a cartographer by any stretch of the imagination, this map looks pretty horrid. If you are a cartographer, this is probably enough to give you an aneurysm. After consulting a few cartographer-friendly websites, I came across ColorBrewer, a tool that helps you generate a great number of colors that are not a complete eyesore. But considering just how diverse d3 is, there have to be some resources for working with colors, right? Yes, there are!
D3-scale-chromatic is the exact tool you’ll be looking for if you’re a web developer looking to plot a bunch of colored maps. And even better, it’s built off ColorBrewer, so minimal redundancy!
Let’s add d3-scale-chromatic to our dependencies first.
<script src="https://d3js.org/d3-color.v1.min.js"></script>
<script src="https://d3js.org/d3-interpolate.v1.min.js"></script>
<script src="https://d3js.org/d3-scale-chromatic.v1.min.js"></script>
The catch is, we can no longer use linear scales, but that’s fine. It should work just as well. Let’s mess around with the sequential scales and see what works for us.
Or a new scale becomes
const colorScale = d3.scaleSequential(d3.interpolateBlues)
   .domain([min, max])
With `d3.interpolateBlues`
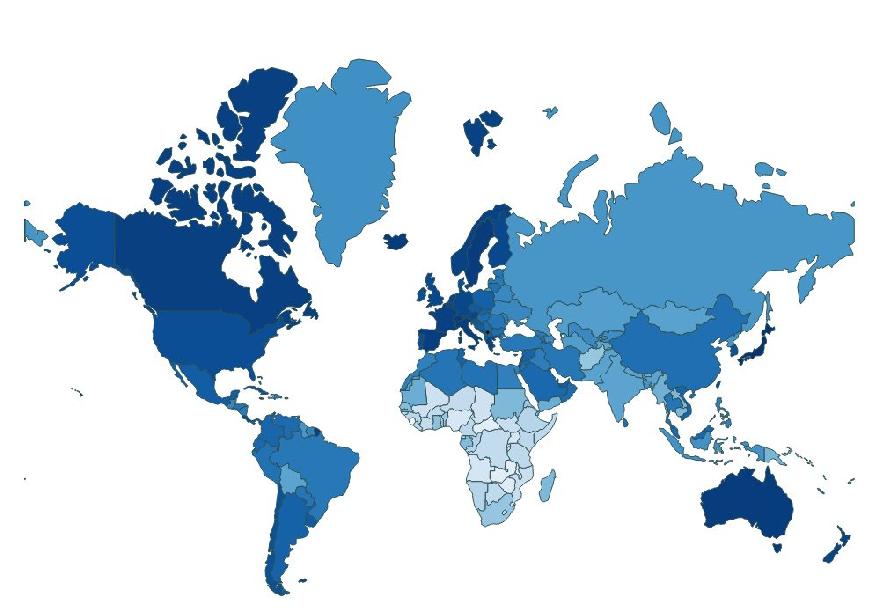
Isn’t that much better?
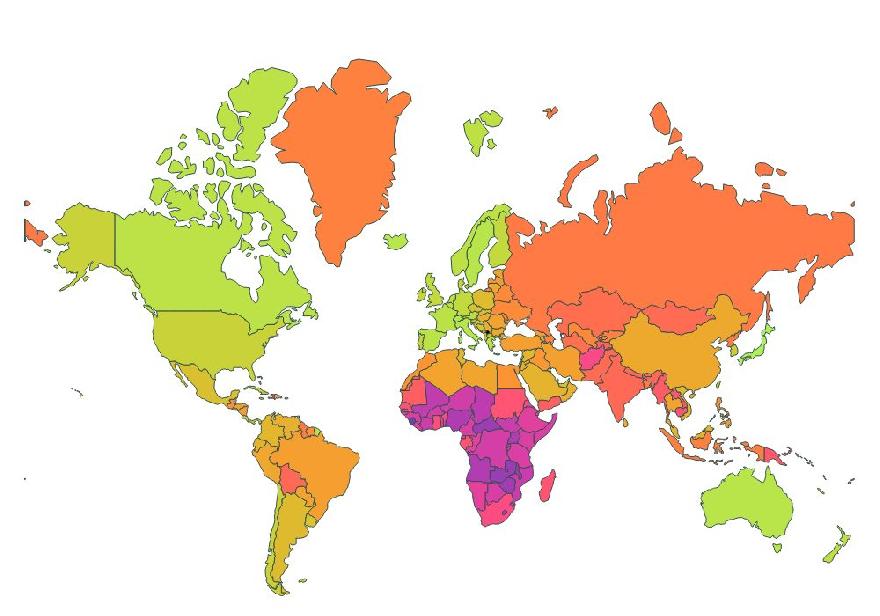
With `d3.interpolateWarm`
But more aptly, our application is going to use a diverging scale. Unlike a sequential scale, which is great for showing linear data, diverging scales place emphasis on extremes. So for this case, we’ll use the ‘interpolateRdYlBu’ interpolator.
Our new scale becomes
const colorScale = d3.scaleSequential(d3.interpolateRdYlBu)
   .domain([min, max])
Now, let’s work on zooming and panning.
Zooming and Panning with d3-zoom
If we only want to focus on a certain region of interest, d3-zoom is incredibly useful. It allows us to zoom and pan to different regions of the map. To use it:
let zoom = d3.zoom()
   .on('zoom', () => {
       svg.attr('transform', d3.event.transform)
   });

svg.call(zoom);
It might be difficult to tell but I struggled quite a bit. It’s impossible to tell where the zoom works and where it doesn’t, so let’s start off by adding a border and a background. This should help provide some much-needed visual feedback.
.home {
 background: ivory;
 border: 1px solid darkgray;
 overflow: hidden;
}
If you remember how scaling works (zooming is basically scaling up and down), we need a scale factor to tell us how much larger we want our original object to go. D3 provides a `scaleExtent` method which we can use to limit how large or small the scale factor can get.
Here’s how we call it:
let zoom = d3.zoom()
   .scaleExtent([1, 2])
   .on('zoom', () => {
       svg.attr('transform', d3.event.transform)
   });

svg.call(zoom);
This tells our zoom function that the minimum scale factor `1` and the maximum should be ‘2’. That is, our map will never be more than two times its original size or smaller than what it was, to begin with.
Here it is in action again:
That’s much better. But we should be able to pan and zoom. How well does panning work?
It’s very jittery and unstable. Note that the video frame rate is limited in this recording so a lot of the jitteriness is lost.
That jitter/stutter when using d3-zoom is because of the way d3 detects zooms and knows where to place the object next. As explained here, d3-zoom determines the coordinates of the mouse relative to the element to find the translation. If you modify the position of the element the zoom behavior is attached to, the relative coordinates used for transforming the SVG are also changed. To make it work, we need to attach the zoom behavior to another element instead.
Let’s change our code to:
let zoom = d3.zoom()
   .scaleExtent([1, 2])
   .on('zoom', () => {
       svg.attr('transform', d3.event.transform)
   });

container.call(zoom);
And to limit how far a person can pan the image:
let zoom = d3.zoom()
   .scaleExtent([1, 2])
   .translateExtent([[-500, -300], [1500, 1000]])
   .on('zoom', () => {
       svg.attr('transform', d3.event.transform)
   });

container.call(zoom);
`translateExtent` takes a single argument [[x1, y1], [x2, y2]]. ‘x1’ is the minimum the image can be panned on the x-axis and ‘x2’ represents the maximum that can be panned on the x-axis.
In other words, this code prevents the image from being panned further than -500 and 1500 on the x-axis. The same goes for -300 and 1000 on the y-axis.
It should now work as expected.
Changing Datasets
And for the final phase of our app, we need to be able to change datasets. We’ll need to refactor our code so that the bulk of the work goes into a `render` function like so:
const render = (path, data, scale) => svg.selectAll()
   .data(data)
   .enter()
   .append('path')
   .attr('d', path)
   .attr('class', 'country')
   .style('fill', function (d) {
       return scale(d.lifeExpectancy);
   }).on('mouseover', function (d) {
       d3.select(this)
           .style('fill', tinycolor(scale(d.lifeExpectancy)).darken(10).toString());
   })
   .on('mouseout', function (d) {
       d3.select(this)
           .style('fill', scale(d.lifeExpectancy));
   })
Since we’ll need to re-render the SVG, the function needed for this will be
function reRender(year) {
   d3.csv(lifeExpectancyCsv).then(data => {
       let mapData = getYearData(data, year, true);

       let extent = d3.extent(mapData, d => d.lifeExpectancy);

       let colorScale = d3.scaleSequential(d3.interpolateRdYlBu)
           .domain(extent)

       let element = document.getElementById('currentYear');
       element.innerHTML = year;
       render(path, mapData, colorScale);
   });
}
Notice that in this case, we had to get the data from the server all over again. Working with global variables is a bit messy in vanilla JS, but if you were using React or something similar, the data can be stored in state and retrieved when needed instead. As a bonus, it also makes transitioning changing datasets much faster and smoother.
Next, let’s move the data mapping functionality into `transformData`:
function transformData(data, currentYear) {
   console.log(data[0]);
   let newArr = _.map(data, era => ({
       entity: era['Entity'],
       lifeExpectancy: +(era['LifeExpectacy']),
       code: era['Code'],
       year: +(era['Year'])
   }));

   return _.filter(newArr, today => {
       return today['year'] === currentYear;
   });
}
And then, merging functionality into `getYearData`
//Since this function is called both by ‘render’ and ‘reRender’, the data may already have been transformed. Attempting to transform it twice will cause errors. In the latter case, no transformation is necessary.
function getYearData(data, currentYear, transform) {
   let currentYearArray = [];
   if (transform) {
       currentYearArray = transformData(data, currentYear);
   }
   else {
       currentYearArray = data;
   }

   return _(currentYearArray)
       .keyBy('code')
       .merge(_.keyBy(worldMap.features, 'properties.iso_a3'))
       .values()
       .value();
}
Then, we’ll add a new script with the methods needed for the addition and subtraction:
<script>
 function addYearAndRerender() {
     currentYear  = currentYear + 1;
     reRender(currentYear);
 }

 function subtractYearAndRerender() {
     currentYear = currentYear - 1;
     reRender(currentYear);
 }
</script>
And, finally, our HTML can become:
<body>
<h1>Life Expectancy of the World Between 2000-2019</h1>
<div style="display:flex; align-items: center">
 <div class="home"></div>
 <div style="margin-left: 24px">
   <h2 id="currentYear">2000</h2>
   <button style="background: rgb(240,246,253)" onclick="subtractYearAndRerender()">
     <
   </button>

   <button style="background: rgb(244,249,254)" onclick="addYearAndRerender()">
     >
   </button>
</div>

 </div>
</body>
Once we bring it all together:
And voila! That’s a wrap.
Notes
- Notice how the US almost always remains blue and multiple parts of Africa change from red to a lighter shade back to red. This is a consequence of the scale/interpolator we’ve chosen. It places emphasis on extremes. A linear scale would be better suited, but creating a suitable domain/range combination takes a considerable amount of effort.
- The final version of this project uses d3-tip to add tooltips. Its documentation is easy to follow.
Resources
Code: https://gist.github.com/Bradleykingz/aa1a7e5b557d2df93a8c66e78196781b
Github: https://github.com/Bradleykingz/working-with-d3-2
JS Fiddle: https://jsfiddle.net/5bLmyfc0/1/