Let’s continue our debug lesson. Let us learn another essential debugging scenario, in particular – debugging with errors in JavaScript. For example, while handling a request:
server.on('request', function(req, res) {
    var urlParsed = url.parse(req.url, true);

    WTF();

    if (req.method == 'GET' && urlParsed.pathname == '/echo' && urlParsed.query.message) {
        res.end(urlParsed.query.message );
        return;
    }

    res.statusCode = 404;
    res.end('Not Found');

});
there is an unknown call WTF() or something else that makes JavaScript fail. Let me launch this server. I open the debugger page in my browser. Now if I follow the server url, no debugging will happen because JavaScript will simply fail. In order to debug JavaScript, you can open your debugger and click the same commands as we would select in a browser debugger. It means we need to activate this code pause button. Now I move to the following page: http://127.0.0.1:1337/, and the debugger stops me on the error WTF.
Let us look at one more debugging example – console utilities. The file pow.js contains the level calculation using a recursive function:
function pow(x, n) {
    if (n < 0) {
        return x
    }
    var result = x* pow(x, n-1);
    return result;
}

console.log( pow(2, 3) );
Being called it should output 23 – node pow.js, but shows 32 instead of 8. So, what’s the reason? To see what’s going on we will try to launch a debugger node debug pow.js. Now, if I try to launch Node-inspector, it will get launched. But in practice, nothing will be debugged. Why? As we understand what’s going on, we can easily explain this thing. Node got launched, opened an access to a port 5858, executed the script – and that’s all, Node has finished its work, it’s outputted everything. No Node-inspector will manage to get connected to it just because it isn’t launched. The Port 5858 is closed. What should we do? The thing we really need at the moment is another debug-brk flag.
node –debug-brk pow.js
It immediately launches the script by entering the pause state. At start it activates a debugger and waits till someone gets connected to it and gives a command to continue its work. To make sure, let us re-launch Node-inspector and I will enter the developing tools via Chrome. I open the respective url and see where the current pause has happened:
function pow(x, n) {
    if (n < 0) {
        return x
    }
    var result = x* pow(x, n-1);
    return result;
}

console.log( pow(2, 3) );
Further I will provide some more details to those of you who, probably, faces these development tools for the first time.
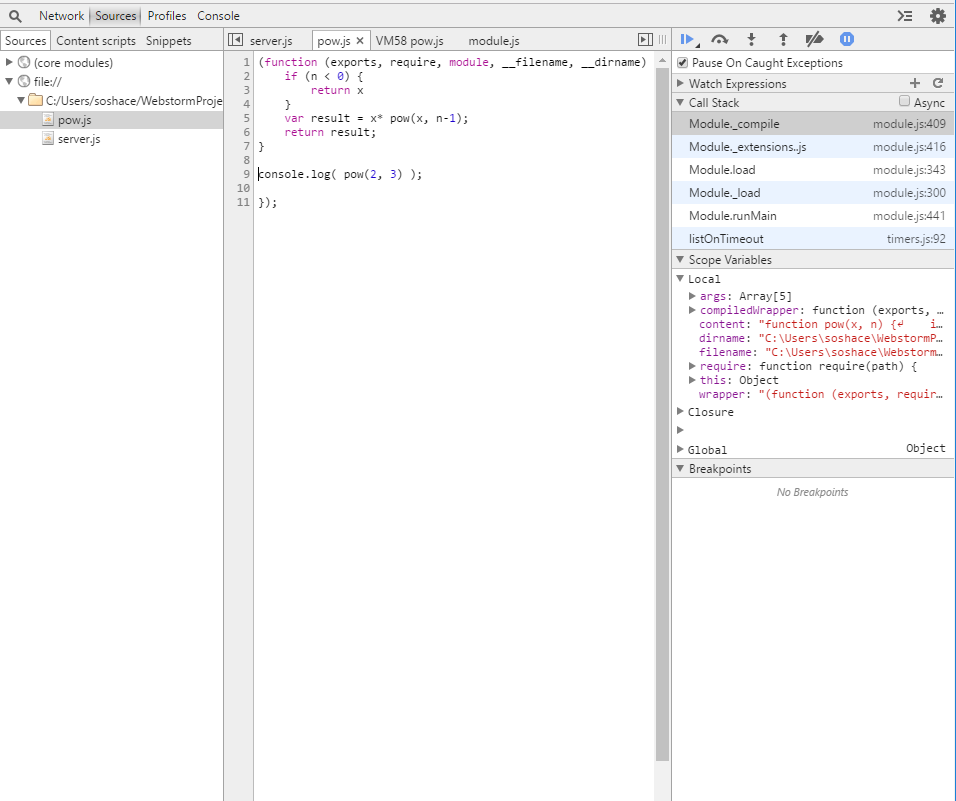
We see the current script; the information and control buttons are on the right. Now I will push the button with an arrow down (F11). It will bring me to the next command. Click it. Where are we now? This moment is rather ambiguous. The thing is that when I try to connect the console object, Node.js does require:
return NativeModule.require(‘console’);
This built-in object does not get launched by default – you need to connect it. We are barely interested in connecting console, that’s why I will push another button, with an arrow up. It means the execution process needs to be continued, but it will stop whenever you log out this function. So, press it.
Now console is connected. The next call is to refer to pow. Press an arrow down. Now we’re inside the pow function.
Now every next pressing of an arrow down will transfer the control inside the nested calls. Pay your attention to Call Stack on the right – it grows. It is a sequence of the function’s nested calls, which have brought them to the current state. In this case, we are interested only in pow.js. It is the only file made by us, the others are built-in modules. Initially it was a console, then another call followed by the next. They differ from each other with their local variables.
Our further debugging steps are quite obvious, that’s why we move to the next debugging method – IDE. We’ll use WebStorm as our IDE. To launch debugging, we’ll take this suitable ready-to-use configuration:
var http = require('http');
var url = require('url');

var server = http.createServer();

server.on('request', function(req, res) {
    var urlParsed = url.parse(req.url, true);
    debugger

    if (req.method == 'GET' && urlParsed.pathname == '/echo' && urlParsed.query.message) {
        res.end(urlParsed.query.message );
        return;
    }

    res.statusCode = 404;
    res.end('Not Found');
});

server.listen(1337);
console.log("Server is running");
The only thing is that we need to launch Node, not a supervisor. Launch a debugger and see what’s happened in the console. At its start in a debugging mode WebStorm adds the respective parameter debug-brk to Node and gives it a value – 62181. This value is a port, where Node should wait for a debugger connection, 62181 by default (in my case). Previously Node-inspector connected to this port; right now WebStorm is connected to it. Respectively, it executes the needed interface. Now, if open the browser and go to this url,
http://127.0.0.1:1337/echo?message=TEST
the system will stop. Here, in WebStorm I can open different thing, analyze variables, view urlParsed, etc.
So, let us sum up the mentioned debugging methods in Node.js.
- The first way is to launch a node debug Node will immediately stop the script execution and move to a special mode of console debugging, where it will get a list of commands via help, control the script execution, enter the console mode through repl. It works, but it’s too simple.
- If you want to have a more convenient interface, use one debugging method in Chrome browser through Node-inspector or under IDE, whether it is possible. To make this type of debugging possible, launch Node with a special flag —debug or debug-brk. In this case, debug-brk will immediately move the script to a pause state. If Node is launched with these flags, it will give an access to the v8 built-in debugging mechanism. Respectively, v8 starts to listen to this port, 5858 by default. The debugger gets connected to it and can send commands controlling the execution process, receiving variables, etc. For Chrome debugging you can use Node-inspector as a debugger, which, from the one side, gets connected to the Node port and can talk to it and, from the other side, it shows a Chrome page and receives commands with its help. You can use other modern browsers instead of Chrome.
- Concerning IDE, we can say that everything depends on the very IDE and how everything’s placed in it. These things can be convenient or not. As for me, I believe the most trusted way is debugging with But you need to launch Node–inspector for it.
You can find lesson’s code here .
The materials were borrowed from the following screencast
We are looking forward to meeting you on our website blog.soshace.com


