

In the last article, we covered the most basic aspects of what memory leaks are, what causes them and how to eliminate them from your program.
As a preamble, memory leaks happen when the garbage collector (GC) is unable to clear unreferenced objects from working memory. Considering how much of its popularity Java owes to its garbage collector, how can it this be possible? As it turns out, the GC has a few weak spots:
Unreferenced static fields: The GC is unable to clear static fields unless the class that owns it is unloaded, which only happens if the Classloader that called it is garbage collected.
Unclosed system resources: The GC indirectly frees up files since classes like FileInputStream are written such that if an instance is garbage collected, the ‘close()’ method will be called first. This way, unclosed system resources don’t always pose a risk, so a lot of developers tend to look over them.
Most systems have hard limits on how many files can be open at once, and in addition to hard-to-reproduce bugs like different processes being unable to access the file or OS errors, such issues can be quite problematic to debug. They aren’t memory leaks in the exact sense but memory usage does remain high in the time that the stream remains open.
Besides, it’s also worthwhile to remember that class unloading may or may not happen depending on the JVM implementation.
Unclosed connections: Like with unclosed resources, unclosed database or network connections can lead to significant memory use if not unloaded.
Additional reasons memory leaks may occur include having a small heap space, excessive page swapping by the operating system and long delays in garbage collection.
The focus of this article is the various techniques that can be used to hunt down memory leaks once you’ve recognized how memory leaks happen.
Diagnosing Memory Leaks in Java
Memory leaks are a problem because they are pretty hard to diagnose. They require some significant debugging skills and a good understanding of the application you’re working with. Unlike most other bugs, your program will run perfectly fine until it doesn’t. You may not notice a memory leak until your application mysteriously crashes.
One of the telltale signs of a memory leak is the dreaded OutOfMemoryError (OOM). This is by no means a guaranteed way of detecting them, however. While OOMs are often a symptom of memory leaks, that’s not always the case.
They happen for a whole host of reasons, but the four most common are as follows:
- Java heap leaks: This is the classic case where something ‘leaks’ in the Java heap. Objects are being created but for whatever reason, they are not being freed up from the Java heap. If this continues for long enough, the heap will fill up and a ‘java.lang.OutOfMemoryError: Java heap space’ error appears.
- Small heap space: By default, the amount of heap space assigned to an application is decided by the amount of physical memory you have and your Java version. If your application is small and doesn’t need much memory, having a small heap space shouldn’t be a problem. With more load, however, you might have to increase it.
- Native issues: This is one of the more difficult types of OOMs to diagnose and solve because the memory allocation failure happens in a JNI or native method, not in the JVM code. This kind of error often occurs when on 32-bit systems due to assigning too much heap space.
Large object allocation requests: An OOM could be thrown when the application requires more Java heap than can be provided. For instance, trying to get a 1GB String object from a 1024MB heap will never work.
How to Detect Memory Leaks
To reliably detect memory leaks, you will have to rely on a combination of different tools and techniques. There are more than a dozen or so of these available, but for the sake of simplicity, the three most effective methods are:
- Using a memory profiler.
- Verbose garbage collection.
- Analyzing heap dumps.
- Using a Memory Profiler
There are a dozen or so different tools that can be used for memory profiling, depending on your preferences. Keep in mind that this tutorial uses the latest version of each of these pieces of software running on Ubuntu 18.04.
The ones I’ve personally tried (and the ones we are going to explore) are:
- Yourkit Java Profiler: Hands-down the most user-friendly and feature-rich tool here. A feature I’ve especially found useful was the ability to export graphs in various formats. The downside – it’s quite pricey.
- VisualVM: Personally my favorite because 1) it’s open source 2) entirely free 3) extremely straightforward. The UI is a bit lacking, often making it feel really gimmicky, it doesn’t have nearly as many features as Yourkit, and I couldn’t get the IDEA integration working for whatever reason. If you’re like me, however, you’ll appreciate the simplicity it brings.
- JProfiler: JProfiler is also invaluable. It’s a lot easier to use than Yourkit, in my opinion, and offers many more features than VisualVM. Before it becomes that easy to use, however, you might have to do some bit of exploration to get everything working.
Now, down to business.
Let’s consider the same example from the last project, with a few variations. Notably, this time we rely on JUnit4 to run our tests.
public class Main {

    private Random random = new Random();
    private static final ArrayList<Integer> list = new ArrayList<>();

    @Test()
    public void givenArrayList_whenStatic_thenShouldLeakMemory() throws InterruptedException {
        for (int i = 0; i < 10000000; i++) {
            list.add(random.nextInt());
        }
        //Give the GC some time to run
        Thread.sleep(10000);
    }
}
It’s a simple program that adds ten million integers to an ArrayList in our class. We’ll go ahead and analyze this program both with and without the static fields in the different profilers we have outlined.
VisualVM
How you run memory profiling on VisualVM depends on the kind of application you have and what part of the program you need to analyze. Unfortunately, VisualVM does not support memory profiling on startup out of the box. You’ll need to install the Startup Profiler plugin.
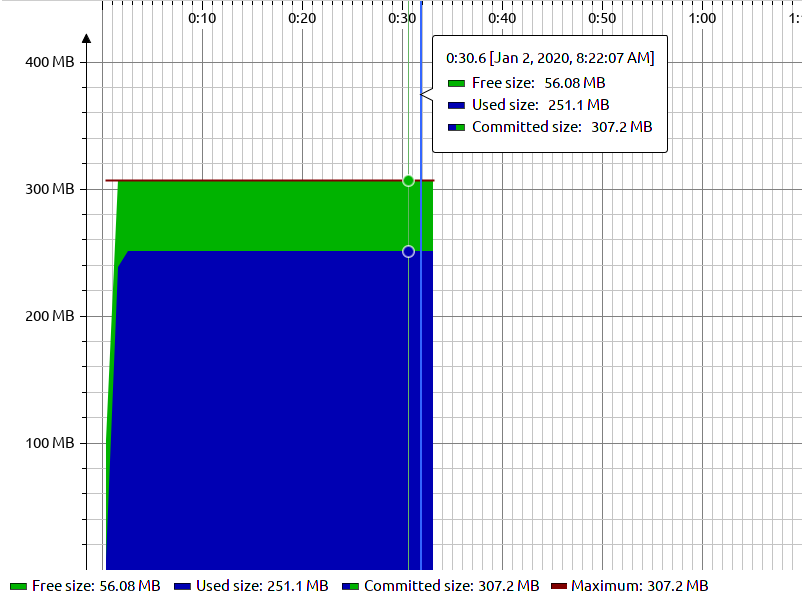
After you’ve followed the instructions shipped with the plugin and run your program, VisualVM produces the following graph:

Notice the gradual rise then drop-off and eventual plateau of the used heap (blue) graph. The amount of heap space used increases as the application runs and drops off slightly as the JVM reclaims unreferenced objects.
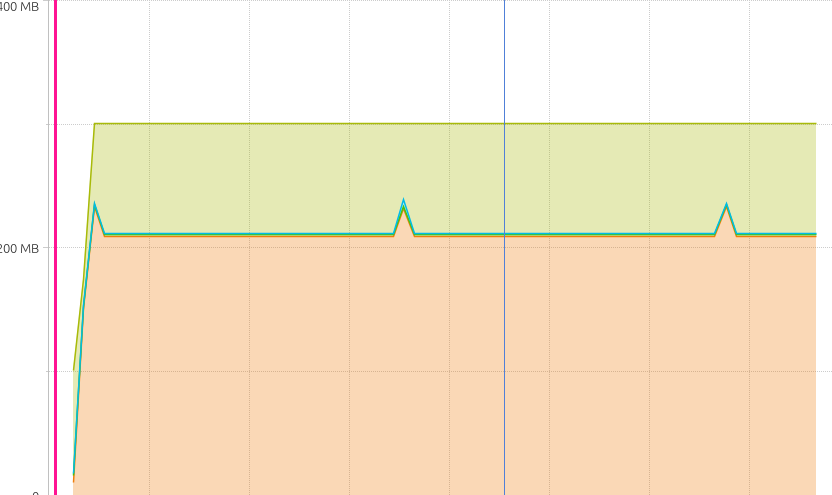
In comparison, a leaky section of your program doesn’t feature any drop-offs in memory usage. Kind of like this:

Yourkit
Yourkit has a handy IDEA integration that lets you launch the profiler right out of the IDE. When run, the same program produces a graph that looks like this:
This ran for a little longer. Every peak is an instance when the program ran and the drop-off an indication of the GC at work.
JProfiler
Setting up JProfiler is pretty much the same thing as with VisualVM. You’ll need to add a new JVM parameter for when your code runs. The code for running your program should look like this at the end of the day:
/usr/lib/JVM/java-11-oracle/bin/java -ea -Xmx300M -Xms100M -agentpath:/home/me/installs/jprofiler11/bin/linux-x64/libjprofilerti.so=port=8849
(-Xmx300M sets the maximum heap size to 300MB and -Xms100M sets the initial heap size to 100MB)
The output of our leaky program looks quite similar to what VisualVM produced earlier.
Verbose Garbage Collection
Verbose garbage collection allows you to collect more details about the garbage collection process than the default settings. It’s a very useful feature and often necessary when tuning and debugging a variety of memory problems you may encounter.
It can be enabled with the -verbose:gc to the JVM configuration of our application. For instance, let’s run our classic app with additional parameters to get a better understanding of what’s going on.
The GC log is an essential tool for revealing potential ways we can improve the heap and garbage collection configurations in our program. It provides details like duration and the results of a GC session, helping us fine-tune performance details like collection times and finding out what heap size works best.
For our purposes, the simple garbage collector enabled using -XX:+UseSerialGC., is all we’re going to need.
Analyzing verbose garbage collection output
Running our leaky program produces the following verbose garbage collection output:
[0.646s][info][gc] GC(0) Pause Young (Allocation Failure) 26M->16M(96M) 40.106ms
[0.721s][info][gc] GC(1) Pause Young (Allocation Failure) 43M->35M(96M) 56.025ms
[0.815s][info][gc] GC(2) Pause Young (Allocation Failure) 60M->60M(96M) 76.046ms
[1.151s][info][gc] GC(4) Pause Full (Allocation Failure) 86M->69M(113M) 238.082ms
[1.151s][info][gc] GC(3) Pause Young (Allocation Failure) 86M->69M(168M) 318.858ms
[1.273s][info][gc] GC(5) Pause Young (Allocation Failure) 115M->113M(168M) 83.191ms
[1.686s][info][gc] GC(7) Pause Full (Allocation Failure) 134M->118M(180M) 306.419ms
[1.686s][info][gc] GC(6) Pause Young (Allocation Failure) 135M->118M(287M) 390.527ms
[1.929s][info][gc] GC(8) Pause Young (Allocation Failure) 198M->197M(287M) 173.211ms
It’s quite a bit to take in at once, so let’s break it down:
[0.721s]
This is a timestamp showing when the GC occurred.
[info]
The log level
[gc]
The channel the log level is coming from.
Pause Young (Allocation Failure)
At the beginning of our application’s lifecycle, the concurrent phases are not yet executed so it functions in the fully-young mode. Once the Young Generation fills up, however, the live data inside the Young regions are copied to the Survivor regions. This process is called Evacuation. During this process, all threads are stopped at a safe point to enable the copying to take place.
With some additional configuration, it’s possible to get additional information, such as when the Evacuation pause started and how long it took. That’s out of the scope of this article.
43M->35M
The amount of heap memory occupied before and after garbage collection ran. They are separated by an arrow.
(96M)
The current capacity of the heap.
56.025ms
How long the GC event took.
Bringing it all together
If the amount of memory being occupied after garbage collection is still significantly high even after garbage collection, there’s a good chance you have a memory leak on your hands. It’s not guaranteed since it only indicates memory depletion which could be a result of dozens of other things, but it should point you in the right direction.
Analyzing heap dumps
Finally, analyzing heap dumps is another great way to narrow down on elusive bugs that may be depleting your available memory. This is especially useful for instances when the program crashes without any useful indication of what caused it, as is often the case with certain OutOfMemoryErrors
A heap dump is a snapshot of the heap memory of Java processes at a given time, in our case, that’s when the program last crashed (and produced a heap dump).
And as far as tools go, there’s possibly no better application for the job than Eclipse Memory Analyzer Tool (MAT).
Pro tip: you might want to increase the heap size available to the program before you use it for the first time.
Let’s tweak our classic leaky program slightly.
package com.testapp.memories;

import org.junit.Test;

import java.util.ArrayList;
import java.util.Random;

public class Main {

    private Random random = new Random();
    private static final ArrayList<Integer> list = new ArrayList<>();

    @Test(expected = OutOfMemoryError.class)
    public void givenArrayList_whenStatic_thenOutOfMemory() throws InterruptedException {
        for (int i = 0; i < 1000000000; i++) {
            list.add(random.nextInt());
        }

        Thread.sleep(10000);
    }
}
This time, we create just a few more objects than the heap can hold and let it run out of memory, producing a heap dump in the process. (You can configure your application to automatically generate heap dumps in case of an OOM by following these instructions).
Alternatively, starting the program with Yourkit will automatically produce heap dumps for you in case of an OOM.
Opening the resulting heap dump in MAT should give you the option to look for suspected memory leaks. If you want a detailed tutorial on how to find memory leaks with MAT, here’s an excellent article by Isuru Perera.
Here’s part of the report that MAT generates:
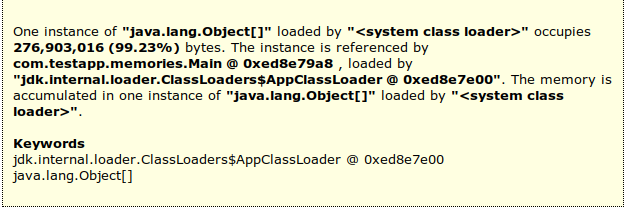
The report is pretty detailed and straightforward. For instance, we can now trace the error to the com.testapp.memories.Main class, and with the additional details MAT provides (and perhaps in conjunction with a profiler) we can track down the error to the method causing issues.
Summary
In this article, we covered three different ways to track down memory leaks in Java. Depending on the amount of experience and expertise you have, either one could work just as well. However, these tools are extremely useful for tracking down all manner of bugs, too, not just memory leaks. Arming yourself with knowledge of them could go a long way.