
Table of Contents:
- Introduction
- Prerequisites
- Java Development Kit (JDK)
- Database
- SonarQube
- Installing SonarQube
- Running SonarQube
- Setting Up Your Project in SonarQube
- Analyzing Your Code with SonarQube
- Reviewing the Analysis Results
- Integrating SonarQube with Your Build Process
- Customizing the Analysis Rules and Quality Profiles
- Monitoring and Managing Your SonarQube Server
- Integrating SonarQube with IDEs
- SonarQube Plugins and Extensions
- Conclusion
A Comprehensive Guide to Setting Up SonarQube in a Project on Your Local Machine.
1. Introduction
SonarQube is an open-source platform for continuous code quality inspection, helping developers write clean, maintainable, and reliable code. It achieves this by detecting bugs, vulnerabilities, and code smells in your source code. Incorporating SonarQube into your project can significantly enhance code quality, maintainability, and security. Additionally, if you’re looking to enhance your project’s documentation or reports, using a free infographic maker can help you create visually appealing infographics.
In this elaborate guide, we will walk you through the process of setting up SonarQube in a project on your local machine, including downloading and installing SonarQube and its prerequisites, analyzing your code, interpreting the results, customizing rules and profiles, and integrating with your build process. By the end of this article, you will have a thorough understanding of how to implement SonarQube in your project and how to utilize its powerful features to improve your code.
2. Prerequisites
Before setting up SonarQube on your local machine, ensure you have the following software installed:
2.1. Java Development Kit (JDK)
SonarQube requires JDK 11 or higher. Download the latest version of the JDK from the official Oracle website (https://www.oracle.com/java/technologies/javase-jdk11-downloads.html).
2.2. Database
SonarQube requires a database to store its analysis data. Supported databases include PostgreSQL, Microsoft SQL Server, and Oracle. The H2 database is the default database for SonarQube. For a seamless experience and better performance, it is recommended to use a dedicated database instance for SonarQube instead of the built-in H2 database that comes with the default setup. The H2 database is suitable for testing purposes, but it is not recommended for production use. For this article, we will just use the H2 database.
2.3. SonarQube
Download the latest version of SonarQube from the official website (https://www.sonarqube.org/downloads/). For this guide, we will use the SonarQube Community Edition, which provides all the essential features for code quality analysis.
3. Installing SonarQube
After downloading the SonarQube ZIP file, follow these steps to install and configure it:
- Extract the ZIP file to a folder of your choice.
- Open the ‘sonarqube-x.x.xconf’ folder (where x.x.x is the version number), and edit the ‘sonar.properties‘ file using a text editor.
- Configure the database connection by uncommenting and updating the following lines:
sonar.jdbc.username=<your_database_username>
sonar.jdbc.password=<your_database_password>
sonar.jdbc.url= // <jdbc url>
Replace <your_database_username>, <your_database_password>, and <jdbc url> with the appropriate values for your PostgreSQL installation.
As I have previously mentioned that I am going to use the built-in H2 database, so I will skip the above configuration.
- Save the ‘sonar.properties‘ file and close it.
4. Running SonarQube
To start the SonarQube server, follow these steps:
4.1. Open a command prompt or terminal window and navigate to the ‘sonarqube-x.x.xbin’ folder.
4.2. Choose the appropriate folder for your operating system (e.g., ‘windows-x86-64’ for 64-bit Windows) and run the ‘StartSonar’ script (startsonar.bat for Windows, startsonar.sh for Linux/Mac).
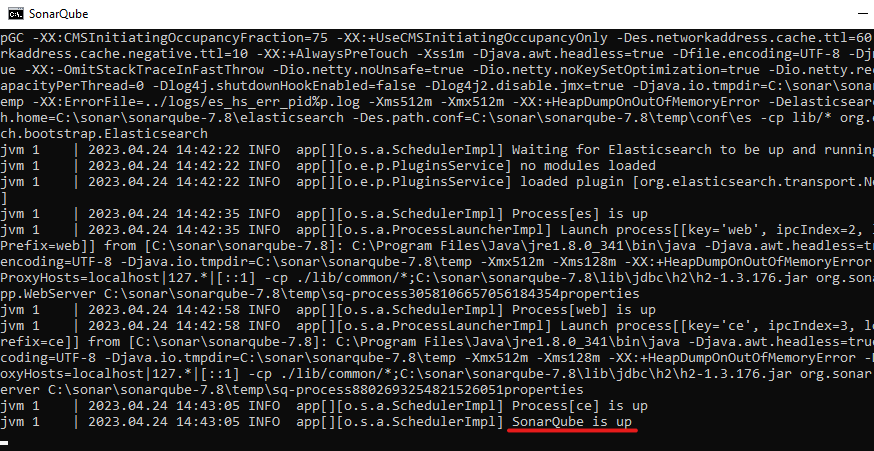
4.3. Wait for the server to start. You should see a message like this when it’s ready:
SonarQube is up
4.4. Open a web browser and navigate to http://localhost:9000 . You should see the SonarQube dashboard.

SonarQube dashboard
5. Setting Up Your Project in SonarQube
To analyze your code with SonarQube, you need to create a project and configure the analysis settings. Follow these steps to set up your project:
- Log in to the SonarQube dashboard using the default credentials: username ‘admin’ and password ‘admin’. You should change these credentials after logging in for the first time.
- Click on the ‘Projects’ tab and then click the ‘Create new project’ button.
- Enter a unique ‘Project key’ and ‘Display name’ for your project, and click the ‘Set Up’ button.
- Select your preferred analysis method. For this guide, we’ll use the SonarQube Scanner, which is a standalone command-line tool that works with most programming languages and build tools.
- Download and install the SonarQube Scanner by following the instructions on the screen. The installation process depends on your operating system and may require adding the scanner’s ‘bin’ folder to your system’s PATH environment variable.
- Configure your project’s analysis settings by creating a ‘sonar-project.properties’ file in your project’s root folder. This file should include the following basic settings:
sonar.projectKey=<your_project_key>
sonar.projectName=<your_project_display_name>
sonar.sources=<your_project_source_folder>
sonar.sourceEncoding=UTF-8
Replace <your_project_key>, <your_project_display_name>, and <your_project_source_folder> with the values you entered in step 5.3 and the path to your project’s source code folder, respectively.
6. Analyzing Your Code with SonarQube
With your project set up in SonarQube and the analysis configuration in place, you’re ready to analyze your code. Follow these steps to run the analysis:
6.1. Open a command prompt or terminal window and navigate to your project’s root folder.
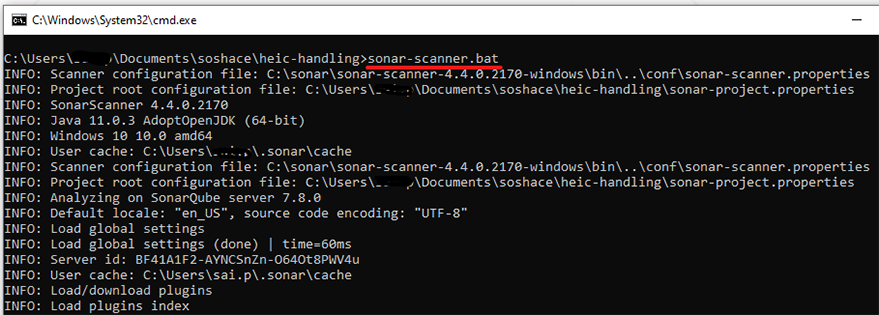
6.2. Run the following command to start the analysis:
sonar-scanner
6.3. Wait for the analysis to complete. The SonarQube Scanner will connect to your local SonarQube server, upload your source code, and analyze it using the configured rules and quality profiles.
6.4. When the analysis is finished, you should see a message like this:
INFO: Analysis report uploaded in Xs
INFO: ANALYSIS SUCCESSFUL

7. Reviewing the Analysis Results
After analyzing your code, you can review the results in the SonarQube dashboard:
7.1. Open a web browser and navigate to ‘http://localhost:9000’.
7.2. Click on the ‘Projects’ tab and select your project.

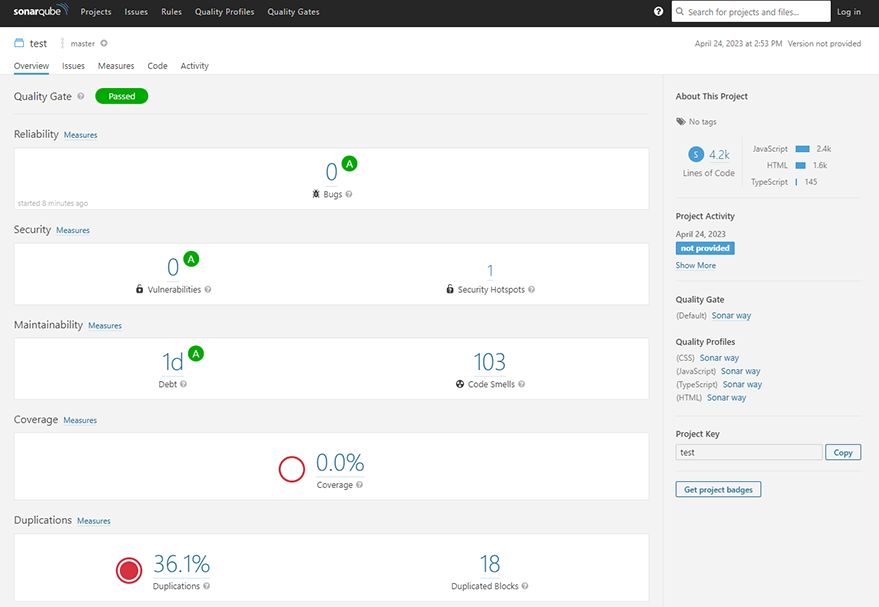
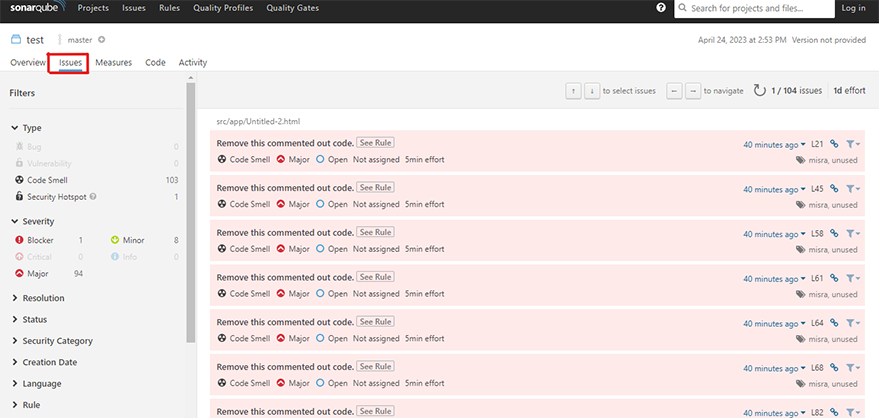
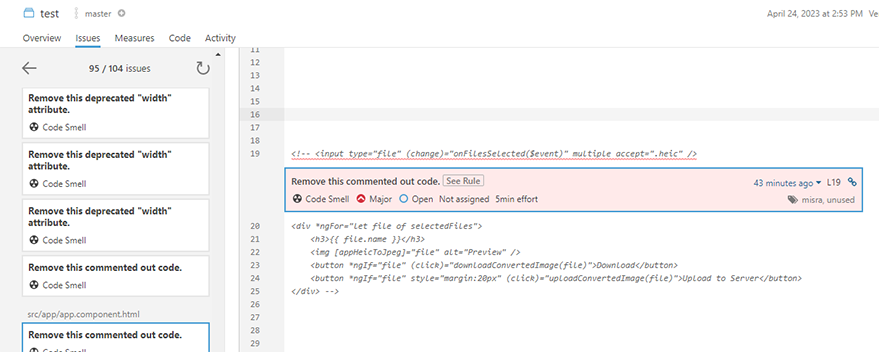
7.3. Explore the various sections of the project dashboard to review the detected issues, code coverage, and other quality metrics. SonarQube organizes issues by severity (Blocker, Critical, Major, Minor, and Info) and type (Bug, Vulnerability, and Code Smell).7.4. Click on individual issues to see their details, including a description of the problem, the affected code, and suggested remediation steps. You can also assign issues to team members, mark them as false positives, or create custom actions to address them.
8. Integrating SonarQube with Your Build Process
To automate the code analysis process, you can integrate SonarQube with your build tools and continuous integration (CI) systems. The specific integration steps depend on your build tool (e.g., Maven, Gradle, Ant) and CI system (e.g., Jenkins, GitLab CI, Travis CI). Consult the SonarQube documentation (https://docs.sonarqube.org/latest/analysis/overview/) for detailed instructions on integrating with various build tools and CI systems.
9. Customizing the Analysis Rules and Quality Profiles
SonarQube comes with a set of predefined rules and quality profiles for various programming languages, such as Java, JavaScript, Python, and C#. However, you may want to customize these rules to better suit your project’s needs and coding standards. Follow these steps to customize the analysis rules and quality profiles:
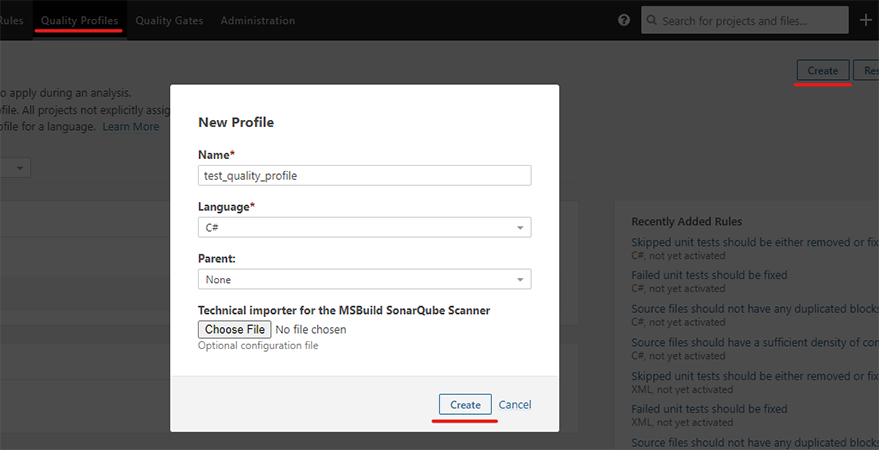
- Log in to the SonarQube dashboard and click on the ‘Quality Profiles’ tab.
- Select the programming language for which you want to customize the rules.
- Click the ‘Create’ button to create a new quality profile, or click the ‘Copy’ button to duplicate an existing profile.
- Give your new quality profile a unique name and click the ‘Create’ or ‘Copy’ button.
- To add or remove rules, click on the ‘Activate More’ button in the ‘Rules’ tab of your new quality profile. Use the search and filter options to find specific rules, and click the ‘Activate’ or ‘Deactivate’ buttons to include or exclude them from your profile.
- You can also adjust the severity of individual rules by clicking on the rule in the ‘Rules’ tab and selecting a new severity level from the dropdown menu.
- Once you’ve finished customizing your quality profile, go back to your project’s dashboard and click on the ‘Administration’ tab.
- Under the ‘Quality Profiles’ section, select your new quality profile for the appropriate programming language and click the ‘Set as Default’ button.

10. Monitoring and Managing Your SonarQube Server
Running a SonarQube server on your local machine requires some ongoing maintenance and monitoring to ensure optimal performance and stability. Here are some tips for managing your SonarQube server:
- Regularly check the SonarQube logs for errors or warnings. The logs are located in the ‘sonarqube-x.x.xlogs’ folder.
- Keep your SonarQube server up to date by periodically upgrading to the latest version. This will help you take advantage of new features, improvements, and bug fixes.
- Monitor the server’s resource usage, such as CPU, memory, and disk space, to ensure that it’s running efficiently and effectively. You may need to adjust the server’s configuration or allocate more resources to meet the demands of your projects and users.
- Regularly back up your SonarQube server’s data, including the database and configuration files. This will help you recover from data loss or corruption if it occurs.
- Configure your SonarQube server to start automatically when your machine starts. This can be done using operating system-specific tools, such as Windows services or Linux init scripts.
11. Integrating SonarQube with IDEs
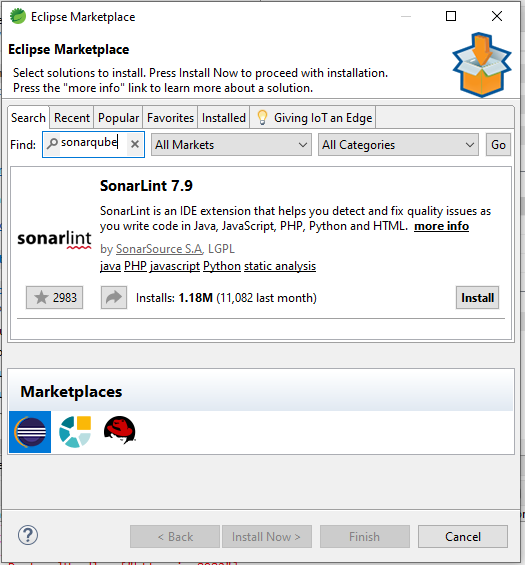
To further enhance your coding experience and make it easier to identify and address issues during development, you can integrate SonarQube with your favorite Integrated Development Environment (IDE). Several popular IDEs, like IntelliJ IDEA, Eclipse, and Visual Studio, have plugins that allow you to connect to your SonarQube server and analyze your code as you write it.
Follow the documentation provided by the respective IDE plugins to set up the integration and start enjoying real-time code analysis feedback while you code.
12. SonarQube Plugins and Extensions
SonarQube has a rich ecosystem of plugins and extensions that can add new features, support additional programming languages, or integrate with third-party tools and services. To browse available plugins, visit the SonarQube Marketplace (https://www.sonarqube.org/plugins/) and follow the installation instructions for the plugins you’re interested in.
Some popular SonarQube plugins include:
SonarLint: A powerful and lightweight extension for various IDEs that provides real-time feedback on code quality issues as you write code. It can connect to your SonarQube server to synchronize rules and settings, ensuring consistent code quality analysis across your development environment.
Dependency-Check: A plugin that helps you identify and remediate known vulnerabilities in your project’s dependencies by checking them against the National Vulnerability Database (NVD). This can help you improve your project’s security by staying up-to-date with the latest vulnerability disclosures and patches.
GitLab Plugin: A plugin that integrates SonarQube with GitLab, enabling you to display code quality metrics and analysis results directly in GitLab merge requests. This can help streamline your code review process and ensure that code quality issues are addressed before changes are merged into your main branch.
13. Conclusion
Incorporating SonarQube into your project can significantly improve your code quality, maintainability, and security. By following this comprehensive guide, you should now have a thorough understanding of how to set up SonarQube in a project on your local machine, analyze your code, interpret the results, customize rules and profiles, and integrate with your build process.
With SonarQube in place, you can continuously monitor your code quality, identify issues early in the development process, and keep your codebase clean, efficient, and secure. As you explore the powerful features of SonarQube and integrate it into your development workflow, you’ll find that it becomes an invaluable tool for writing better code and producing higher-quality software.

