Memory Leaks in Java: A Cautionary Tale and Gentle Introduction to Preventing Memory Errors

Memory Leaks
Memory is one of the most precious resources developers have at their disposal. As such, memory efficiency is at the heart of any program you’re ever going to write. A program can be said to be memory efficient when it utilizes as little memory as possible when in operation while still doing what it was designed to do.
What is a Memory Leak?
A memory leak happens when objects are no longer being used by your application, but the garbage collector (GC) is unable to clear them from working memory. This is problematic because these objects are taking up memory that could otherwise be used by other parts of your program. With time, this builds up and leads to a degradation in system performance over time.
Garbage Collection in Java
Java grew into popularity in large part thanks to its automatic memory management. The GC is a program that implicitly takes care of memory allocation and deallocation. It’s a pretty nifty program and can handle the majority of memory leaks that are likely to occur. However, it’s not foolproof. Memory leaks can still sneak up on the unsuspecting developer, taking up precious resources and, in extreme cases, result in the dreaded java.lang.OutOfMemoryError. (It’s important to note that an OutOfMemoryError is not necessarily because of memory leaks. At times, it’s just poor code practices like loading large files in memory).
RAM prices have hit a historic low in 2019 and have been gradually going down for the last decade or so. A lot of developers have the luxury of never having to deal with insufficient memory, but that doesn’t make the problem any less apparent.
Android developers are particularly prone to running out of memory because mobile devices have access to far less RAM than their PC counterparts. Most modern phones use LPDDR3 (Low Power Double Data Rate 3) RAM as compared to the DDR3 and DDR4 components you will find in most PCs. In other words, while 8GB of RAM is quite generous for a phone, it’s not as powerful as what you’d get in a PC.
Not to lose focus, more (powerful) RAM doesn’t get rid of the problem entirely. An app riddled with memory leaks will suffer serious performance issues as the GC uses up more and more CPU in an attempt to clean up unreferenced objects. If the application grows too large, performance will severely drop off due to swapping or be killed by the system.
Memory leaks should be of concern to any Java developer. This article explores their causes, how to recognize them and how to deal with them in your application. While there are a lot of intricacies that come with dealing with more constrained memory on mobile devices, this article explores memory leaks and how to deal with them in Java SE (the regular Java most of us are used to).
What Causes Memory Leaks?
Memory leaks can be caused by a dizzying number of things. The three most common causes are:
- Misused static fields
- Unclosed streams
- Unclosed connections
a) Misused static fields
Static fields will live in memory as long as the class that owns it is loaded in the JVM – that is, when there are no instances of the class in the JVM. At this point, the class will be unloaded and the static field will be marked for garbage collection. The catch? Static classes can live in memory basically forever.
Consider the following code:
1 2 3 4 5 6 7 8 9 10 11 12 13 14 15 16 17 18 19 20 21 22 23 24 25 26 27 28 29 30 | package com.memories; import java.util.ArrayList; import java.util.List; import java.util.Random; import java.util.logging.Logger; public class Main { public List<Integer> list = new ArrayList<>(); public void populateList() { Logger.getGlobal().info("Debug Point 2"); for (int i = 0; i < 10000000; i++) { list.add(new Random().nextInt()); } Logger.getGlobal().info("Debug Point 3"); } public static void main(String[] args) { Logger.getGlobal().info("Debug Point 1"); new Main().populateList(); Logger.getGlobal().info("Debug Point 4"); try { System.gc(); Thread.sleep(5000); } catch (InterruptedException e) { e.printStackTrace(); } } } |
As far as programs go, this isn’t very impressive: we create a new class that has a public ArrayList. We then populate this ArrayList with a million records. Using our handy open-source Java profiling tool, VisualVM, we get the following graph after it runs:
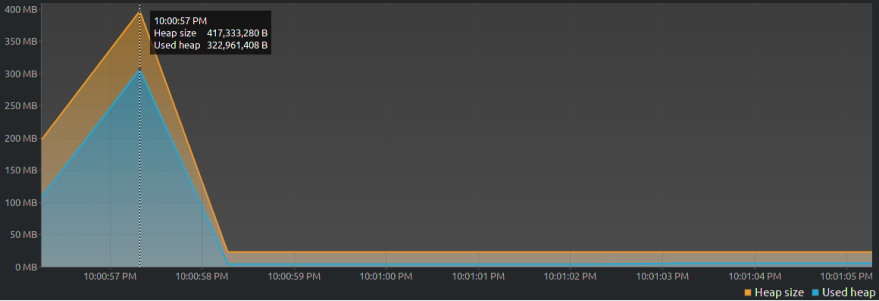
VisualVM graph
At the 1-second mark, the heap size increases as the JVM assigns ~417MB to our program and within the additional second it takes to run, the JVM cleans up everything from memory. Both the used and assigned memory go down and the program shuts down.
Let’s compare that with the previous code tweaked to make the ArrayList static:
1 2 3 4 5 6 7 8 9 10 11 12 13 14 15 16 17 18 19 20 21 22 23 24 25 26 27 28 29 30 | package com.memories; import java.util.ArrayList; import java.util.List; import java.util.Random; import java.util.logging.Logger; public class Main { public static List<Integer> list = new ArrayList<>(); public void populateList() { Logger.getGlobal().info("Debug Point 2"); for (int i = 0; i < 10000000; i++) { list.add(new Random().nextInt()); } Logger.getGlobal().info("Debug Point 3"); } public static void main(String[] args) { Logger.getGlobal().info("Debug Point 1"); new Main().populateList(); Logger.getGlobal().info("Debug Point 4"); try { System.gc(); Thread.sleep(5000); } catch (InterruptedException e) { e.printStackTrace(); } } } |
This time, the heap size increases to ~390MB and after the program is done running (at the point with a slight downward slope) the used memory remains stagnant till the program ends.
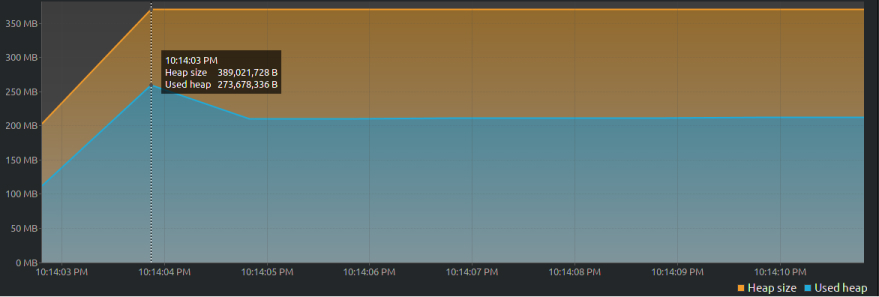
VisualVM graph -2
How to avoid this mistake: Minimize the use of static fields in your application.
b) Unclosed streams
In the context of this article, a memory leak is defined as happening when code holds a reference to an object so that the garbage collector can’t do anything about it. By that definition, a closed stream isn’t exactly a ‘memory leak’ (unless you have an unclosed reference to it).
However, most OSs will limit how many files (in the case of FileInputStream) an application can have open at once. If such a stream isn’t closed, it may take quite some time before the GC realizes those streams need to be closed, so it is a leak, just not a memory leak per se.
A more compelling example would be loading a large object using URLConnection (or similar classes).
The following code will cause potential issues down the line if we don’t close both FileInputStream and ReadableByteChannel.
1 2 3 4 5 6 7 8 9 10 11 12 13 14 15 16 17 18 19 20 | package com.memories; import java.io.*; import java.net.MalformedURLException; import java.net.URL; import java.net.URLConnection; import java.nio.channels.Channels; import java.nio.channels.ReadableByteChannel; import java.nio.charset.Charset; public class URLeak { public static void main(String[] args) throws IOException { URL url = new URL("https://raw.githubusercontent.com/zemirco/sf-city-lots-json/master/citylots.json"); ReadableByteChannel rbc = Channels.newChannel(url.openStream()); FileOutputStream outputStream = new FileOutputStream("/"); outputStream.getChannel().transferFrom(rbc, 0, Long.MAX_VALUE); } } |
The simple fix is to close your streams.
1 2 3 | //... outputStream.close(); rbc.close(); |
c) Unclosed connections
Unclosed database connections present a difficult issue to debug. As reflected in the title, I learned this lesson the hard way when implementing some functionality on my website. Every time there was traffic, nothing would happen. No errors, no exceptions, and no crashing, but the server would time out on every request. Even stranger, once the number of requests went down, so did the mysterious error.
A little digging would reveal that during such times, all processes involving the database were queued but never processed. Something was holding up the database.
Eventually, we ran into code that looked like this littered all over:
1 2 3 4 5 6 7 8 9 10 11 12 13 14 15 16 17 18 19 20 21 22 23 24 25 | package com.memories; import java.sql.Connection; import java.sql.PreparedStatement; import java.sql.SQLException; public class DBLeak { public static void main(String[] args) throws SQLException { Connection connection = JDBCHelper.getConnection(); PreparedStatement stmt = null; try { stmt = connection.prepareStatement("SELECT ..."); } catch (SQLException e) { e.printStackTrace(); } finally { // Release the statement stmt.close(); // Notice how the connection is never closed. Easy to miss. } } } |
Arguably a worse example of the same would be:
1 2 3 4 5 6 7 8 9 10 11 12 13 14 15 16 17 18 19 20 21 22 23 24 25 26 27 28 29 30 31 32 33 34 35 | package com.memories; import java.sql.*; public class DBLeak1 { public static void main(String[] args) { try { String realName = getRealNameFromDatabase("aFriskyWaterMelon", "team90%waterFortheWin"); System.out.println(realName); } catch (SQLException e) { e.printStackTrace(); } } public static String getRealNameFromDatabase(String username, String password) throws SQLException { Connection con = DriverManager.getConnection("jdbc:myDriver:devDB", username, password); Statement stmt = con.createStatement(); ResultSet rs = stmt.executeQuery("SELECT first_name, last_name FROM users"); String firstName = ""; String lastName = ""; while (rs.next()) { firstName = rs.getString("first_name"); lastName = rs.getString("last_name"); } return firstName + " " + lastName; } } |
In this case, every resource leaks.
Luckily enough, there are several ways to fix this problem:
- Use an ORM: ORMs take care of opening and closing any resources for you. For SQL, one of the most popular options is Hibernate.
- Automatic resource management is a long-awaited feature that was finally introduced in Java 8. It’s also known as ‘try-with-resources.’
- Use jOOQ: JOOQ is not precisely an ORM but it does manage all database resources automatically for you.
How to Detect Memory Leaks
Use a profiler
A profiler is a tool that lets you monitor different aspects of the JVM including thread execution and garbage collection. It’s useful if you want to compare different approaches and find which one is the most efficient at functionality like memory allocation.
In this tutorial, we’ve used VisualVM but tools like Mission Control, Netbeans Profiler, and JProfiler are all available if VisualVM doesn’t suit your fancy.
Using heap dumps
If you’d rather not learn how to use another new tool, heap dumps might be of assistance. A heap dump is a snapshot of all objects in memory in the JVM at any one instance. Heap dumps allow you to see how much space certain objects in the JVM take up at any particular point. They are useful for knowing how many objects your application generates.
NB: We haven’t covered the final section in a whole lot of depth, but that’s because detecting memory leaks is a whole beast on its own. It needs an article of its own to cover all the little details that might have otherwise blindsided you.
Summary
Memory leaks are a pertinent problem to most developers and should not be taken lightly. They are difficult to detect and arguably even more difficult to solve if they occur in production, eventually resulting in fatal application crashes. However, following best practices like writing tests and code reviews and profiling can help minimize the chances of memory loss in our applications.
The next part: “Hunting Down and Fixing Memory Leaks in Java“
About the author


Top developers
-

 Alexey D. Frontend DeveloperJSReactHTMLCSSAngularShow lessAll skills
 Dragos S. Full Stack DeveloperJSAngularNode.jsShow lessAll skills
 Juan F. Senior JavaScript developer
Related articles

 9.01.2024
Sending Emails in Java Applications: A Comprehensive Guide to JavaMail and SMTP Configuration
The JavaMail API, part of the Java EE (Enterprise Edition) platform, simplifies the process of sending and receiving emails in Java applications. It ...

 15.05.2023
10 Practices You Should Avoid to Become a Good Java Developer
Java is an object-oriented, case sensitive and class based programming language. It strictly follows the concept of OOPs(Object oriented programming ...

 8.12.2020
Spring Security Basics
Spring Security is a framework for securing Spring-based applications. In this article, we will look over the core Spring Security ...
Categories


3 comments
>How to Detect Memory Leaks
Most interesting part for me, pity, that it wasn’t covered in details.
it will be covered in the next blog post, stay tuned 😉
Well explained. Worth reading ..