Data Science Life Cycle Overview

Data Science Life Cycle
In this article, we’ll discuss the data science life cycle, various approaches to managing a data science project, look at a typical life cycle, and explore each stage in detail with its goals, how-tos, and expected deliverables. We’ll not delve into the details of frameworks or languages, rather, will cover the basic theoretical structure of a typical data science project life cycle.
What is data science?
Data science (DS, the subject we’ve extensively covered in our previous blog post, Data Science Overview) is a multidisciplinary field that uses scientific methods to extract insights from structured and unstructured data. Data science is such a huge field and concept that’s often intermingled with other disciplines, but generally, DS unifies statistics, data analysis, machine learning, and related fields.
What is the data science life cycle?
Data Science life cycle provides the structure to the development of a data science project. The lifecycle outlines the major steps, from start to finish, that projects usually follow. Now, there are various approaches to managing DS projects, amongst which are Cross-industry standard process for data mining (aka CRISP-DM), process of knowledge discovery in databases (aka KDD), any proprietary-based custom procedures conjured up by a company, and a few other simplified processes, which we’ll cover in a moment.
A five-minute overview of what we’ll be discussing in greater detail below:
Data science project life cycle
Now let’s outline the steps involved in a DS project life cycle as stated by the above-mentioned approaches.
CRISP-DM
CRISP-DM is an open standard process model that describes common approaches used by data mining scientists. In 2015, it was refined and extended by IBM, which released a new methodology called Analytics Solutions Unified Method for Data Mining/Predictive Analytics (aka ASUM-DM).
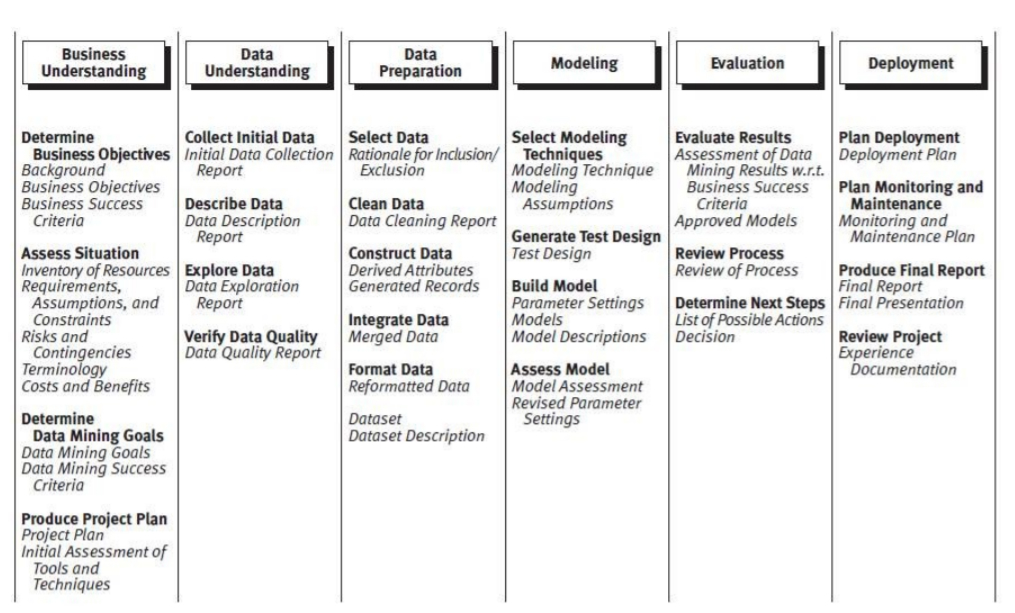
The CRISP-DM model steps are:
1. Business Understanding
2. Data Understanding
3. Data Preparation
4. Modeling
5. Evaluation and
6. Deployment
KDD
KDD is commonly defined with the following stages:
- Selection
- Pre-processing
- Transformation
- Data mining
- Interpretation/evaluation
The simplified process looks as follows: (1) Pre-processing, (2) Data Mining, and (3) Results Validation.
This video, for example, discusses eleven steps that go into the life cycle of a Data Science project:
Of course, depending on the size of an organization and specific project, the maturity of big data and data science management within the company, the DS project lifecycle will significantly differ. In practice, the typical DS life cycle resembles an engineering process (check our article on software development life cycle) that accounts for resource constraints and time-to-market considerations.
Suppose we have a standard DS project (without any industry-specific peculiarities), then the lifecycle would typically include:
- Business understanding
- Data acquisition and understanding
- Modeling
- Deployment
- Customer acceptance
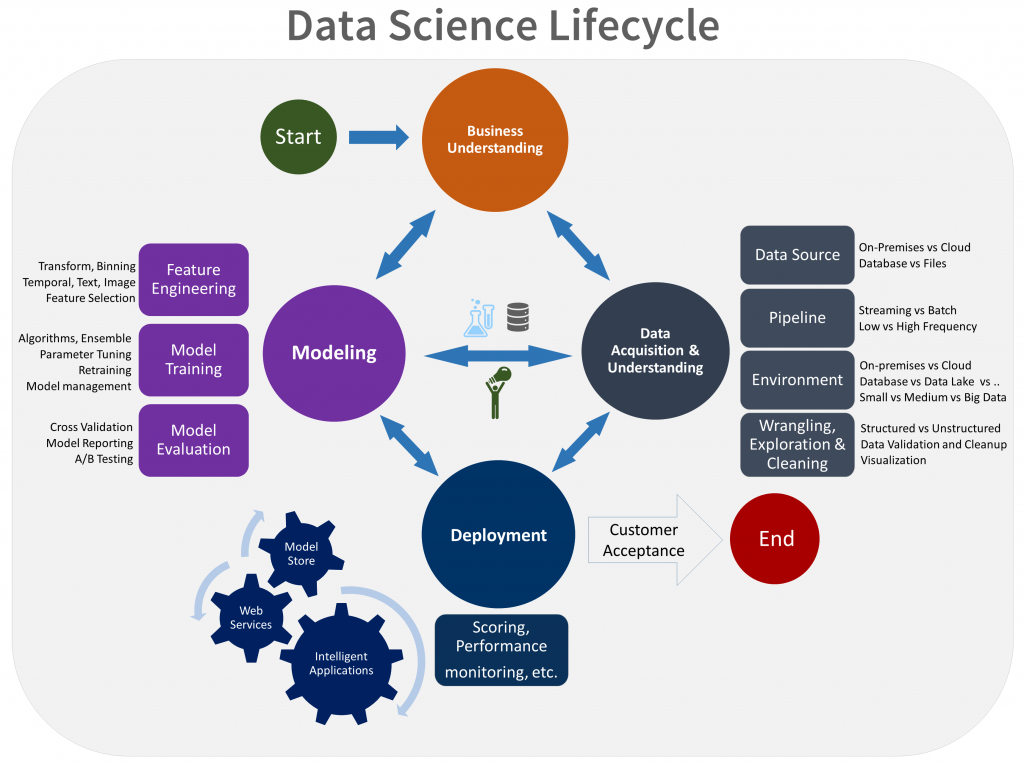
The DS project life cycle is an iterative process of research and discovery that provides guidance on the tasks needed to use predictive models. The goal of this process is to move a DS project to an engagement end-point by providing means for easier and clearer communication between teams and customers with a well-defined set of artifacts and standardized templates to homogenize procedures and avoid misunderstandings.
Each stage has the following information:
- Goals and specific objectives of the stage
- A clear outline of specific tasks and instructions on how to complete them
- The expected deliverables (artifacts)
Now let’s look at each of those steps in greater detail below:
Business understanding
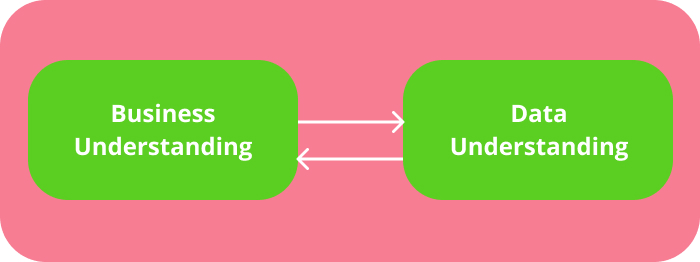
Business and Data Understanding
Before you even embark on a DS project, you need to understand the problem you’re trying to solve and define the central objectives of your project by identifying the variables to predict.
Goals:
- Identify key variables that will serve as model targets and serve as the metrics for defining the success of the project
- Identify data sources that the business has already access to or need to obtain such access
Guidelines:
Work with customers and stakeholders to define business problems and formulate questions that data science needs to answer.
The goal here is to identify the key business variables (aka model targets) that your analysis needs to predict and the project’s success would be assessed against. For example, the sales forecasts. This is what needs to be predicted, and at the end of your project, you’ll compare your predictions to the actual volume of sales.
Define project goals by asking specific questions related to data science, such as:
- How much/many? (regression)
- Which category? (classification)
- Which group? (clustering)
- Does this make sense? (anomaly detection)
- Which option should be taken? (recommendation)
Build a DS team, specify the roles and responsibilities of each member, develop a detailed plan of action with measurable and clear milestones that can be altered or iterated as soon as you discover more information.
Define the success metrics using SMART mnemonic: specific, measurable, achievable, relevant, and time-bound.
Find the data sources that help you answer the questions that define the objectives of the project
Now, you need to find the data sources that contain examples of answers to some of your questions posed earlier:
- Find the relevant data which have measures of your target or features related to the target
- Find the data that’s an accurate measure of your model target
- See if your data needs to be updated with external data or new data needs to be collected
Artifacts:
The deliverables that you will be expected to present at this stage include:
- Charter document, which is a living document that gets updated throughout the project, as new data or requirements arise.
- Data sources, a document which specifies the original and destination locations of the raw data
- Data dictionaries provide descriptions of the data supplied by the client including information about the schema and the entity-relation diagrams
Data acquisition and understanding
When you are done with defining your business objectives, it’s time to actually gather the data, the process best known as data mining.
Tech tip: You’ll need query databases, using MySQL to process data. Using Python or R with the specific packages, you may retrieve data from files received in Microsoft Excel. Some other databases you can encounter include PostgreSQL, Oracle, or MongoDB. To obtain data from the web, you may need to use Web APIs or web scraping tools like Beautiful Soup. Obtaining data directly from files in CVS or TSV format will require the use of a special Parser.
Usually acquiring and processing data takes a lot of time and effort, even more so, when you start cleaning and preparing your data for further stages because there might be multiple scenarios that need to be cleaned or data might render inconsistencies or data set can be missing values or there is some data that’s unnecessary and so on.
Tech tip: Python, R, or Open Source tools like OpenRefine will help you scrub data. Otherwise, you may use custom enterprise solutions like SAS Enterprise Miner. For bigger data sets, you’ll be required to have skills in MapReduce, Hadoop, or Spark.
After your data’s cleaned, you can begin an analysis, aka data exploration, which involves understanding the patterns in the data and retrieving any useful insights from it. At this stage, it’s also crucial to establish the data pipeline to score the new or regularly refreshed data.
Tech tip: for data exploration and if you’re using Python, you’ll need to get a good grasp of Numpy, as well as Matplotlib, Scipy, or Pandas, if you’re using R, the knowledge of GGplot2 or Dplyr will be essential. Data visualization and inferential statistics are a must.
This video from Dr Mike Pound might be very helpful in understanding the data and process of data visualization:
Goals:
- Produce a high-quality data set with clear and comprehensible relationships to the target variables and locate that data set in the appropriate analytics environment
- Build a solution architecture of a data pipeline that refreshes and scores the data on a regular basis
Guidelines:
Here’s what you need to do:
Ingest the data into the target analytic environment
Ingesting data implies setting up the process of moving data from its source locations to the target locations where you run analytics operations.
Explore the data and see if it’s adequate to answer your questions
Develop a sound understanding of your data by auditing the quality of the data with data summarization and visualization and make it ready for modeling. Use automated utilities to help you explore, visualize, or summarize the data or if you can, create a customized solution that would suit your goals and that of your organization.
Again a great tutorial from Dr Mike Pound on cleaning data:
After you’ve cleaned your data, it’s time to better understand it by establishing the patterns which will later help you to develop a predictive model for your target. At this step, which is often iterative, you might need to add new data, find new data sources, augment the data set that was previously defined.
Set up a data pipeline to score the new or regularly refreshed data
Herein, you build a solution architecture of the data pipeline which is generally achieved simultaneously with other stages of the DS project life cycle. Depending on your needs, the nature of the business, constraints of the system, your pipeline can be batch-based, streaming or real-time, or hybrid. Here’s an example of how to set up a pipeline with Azure Data Factory.
Artifacts:
These deliverables are expected at this stage:
- Data quality report includes data summaries, the relationship between attribute and target, variable ranking, etc. Use any available tool (for example, IDEAR) that can generate such a report for you.
- Solution architecture can be in the form of a diagram/description of your data pipeline
- A checkpoint decision is used to determine if the value expected is sufficient to continue its pursuit.
Modeling
Modeling implicates the creation of data features from the data you processed to carry on data training. Data training, in turn, involves a series of iterative steps, such as splitting the input data randomly for modeling into a training data set and a test data set; building models with a test data set; evaluating the training and test data sets using machine learning algorithms; finding the best solution by comparing the success metrics between alternative methods; and finally determining if the model is suitable for production. Now, let’s look at this stage through the prism of the earlier defined required information, such as goals, guidelines, and expected deliverables.
Goals
- Determine the optimal data features for the machine learning model
- Create the machine learning model that most accurately predicts the target
- Ensure the machine learning model is suitable for production
Guidelines
Create data features to facilitate model training
During this step, which is best known as feature engineering, you’ll need to include, aggregate, and transform the raw variables to create distinctive features used in the analysis. Feature engineering is a subtle and balancing act of finding informative and discarding uninformative variables, as well as generating features for any new variables that are obtained during scoring.
This is a great explanation by Dr. Mike on data transformation:
Find the model that answers the question most accurately
Depending on what sort of problem you’re trying to solve, there will be numerous modeling algorithms available at your disposal, and you’ll be expected to choose an appropriate algorithm for your particular problem. To understand how to approach such a problem, you’ll need to do the following:
- Split the input data into a training data set and test data set
- Build the models using a training data set
- Evaluate both the training and test data sets using a series of machine learning algorithms and tuning the parameters (best known as parameter sweep)
- Find out the best solution by comparing the success metrics
For Azure machine learning, there’s an automated modeling and reporting tool that runs through multiple algorithms and parameter sweeps to produce a baseline model along with a baseline model report that summarizes the performance of each model and parameter combination.
Determine if the model is suitable for production
Artifacts
- Feature sets that contain pointers to the code that generated the features and a description of those features were generated
- The model report contains the details on each experiment
- Checkpoint decision evaluates if the model performs well enough to deploy
Tech tip: you’ll need to know supervised and unsupervised algorithms; for Python libraries — Sci-kit Learn, for R — CARET.
Deployment
Goals
The goal is to finally deploy your model into a production-like environment for later user acceptance.
Guidelines
Operationalize the model
To deploy models, you expose them with an open API interface, which enables the model to be easily consumed by various applications, like online websites, spreadsheets, dashboards, back-end apps, etc.
Artifacts
- A status dashboard that displays the system health and key metrics
- Final modeling report with deployment details
- The final solution architecture document
This is the talk from DataWorks Summit where the speaker addresses various possibilities and best practices to bring machine learning models into production environments:
Customer acceptance
Goals
The obvious and the main goal here is to finalize the project deliverables, confirm the pipeline, the model, the deployment in a production environment with the customers and ensure their satisfaction.
Guidelines
Confirm the deployed model and pipeline with the customer
During this step, all documentation is reviewed and finalized.
Hand the project off to the entity responsible for the production
The entity might be an IT team or customer data science team or any other agent of the customer’s responsible for production.
Artifacts
- Exit report of the project for the customer
Complimentary reading material on the blog:
13 Best Data Science Podcasts
11 JavaScript ML DS Libraries
Data Science Overview
Overview of Basic Data Structures
About the author


Top developers
-

 Alexey D. Frontend DeveloperJSReactHTMLCSSAngularShow lessAll skills
 Juan F. Senior JavaScript developerJSReactNode.jsHTMLCSSShow lessAll skills
 Tedi C. Full-stack React/PHP developer
Related articles

 8.05.2020
Top Seven Remote Working Tools You Simply Need In 2020
Many team managers even didn’t have the right tools and equipment to set up a professional working environment at home that enhances efficiency and ...
 9.04.2020
The Bootstrapped Guide To Set Up & Hire A Remote Workforce
You decided to start a remote team, but there is one problem, you are bootstrapped and don't have the budget of venture-backed mega startups. Learn ...

 26.03.2020
Developer Guide to the CCPA
If you are a developer, the chances are that Californian residents are going to interact with your website or application. Under the CCPA regulation, ...
Categories


No comments yet